
The 2021 Census of Population Consultation Results: What we heard from Canadians
Skip to text
Text begins
Introduction
Data from the Census of Population are important for all communities and are vital for planning services that support employment, education and health care. Governments, businesses, associations, organizations and many others use these data to make important decisions. The census provides information that reflects Canada’s changing society and is the primary source of sociodemographic data for specific population groups such as lone-parent families, Indigenous peoples, immigrants, seniors and language groups.
Adjusted population counts from the census are then used as the base for the Population Estimates Program. Population estimates are used to determine representation in Parliament, calculate transfer payments between levels of government and support various government programs across the country.
Evaluating and revising census questionnaire content ensure that it continues to be relevant. We consider the following factors when evaluating the census questionnaire:
- legislative requirements
- program and policy needs
- burden on Canadians when answering questions
- privacy concerns
- input from consultation and testing
- data quality
- cost and operational considerations
- historical comparability
- availability of alternative data sources.
Consulting with census data users and the Canadian public allows Statistics Canada to identify whether or not the questions asked in the census are relevant, how census data are used and how important the census is to Canadians. A formal consultation is set at the start of each census cycle. During that time, Statistics Canada invites data users, stakeholders and the general public to provide feedback on what information they use, for what purpose and what, if any, data gaps Statistics Canada should consider addressing in the next census cycle.
Statistics Canada conducted its consultation process for the 2021 Census from fall 2017 to spring 2018 using an online questionnaire and face-to-face discussions with stakeholders. All Canadians were welcome to participate in the online consultation. More than 2,800 respondents participated, an unprecedented number that demonstrated a high level of interest in helping to shape an important source of demographic and social information for decision making and analysis. Detailed responses were received from organizations and individuals representing federal, provincial, territorial and local government departments; First Nations people, Métis and Inuit; the general public; academia; special interest groups; and the private sector.
The country relies on high-quality information from the census. Statistics Canada uses the best standards and scientific methodology to design content for the Census of Population questionnaire. The longstanding and well-established process to determine census content has been in place for many censuses. It begins with broad consultations with data users, followed by qualitative tests and, finally, a quantitative content test.
Based on the findings from consultations, Statistics Canada modifies the questions asked in the census. In 2018, various versions were tested qualitatively through cognitive, one-on-one interviews. These interviews were conducted across Canada in both official languages. Based on the results of qualitative testing, the census questionnaires were further revised and will be tested quantitatively among 250,000 households during the 2019 Census Test. After statistically analyzing the results of the 2019 Census Test and considering costs, operational factors and safeguards against quality loss, Statistics Canada will make recommendations to the government, which will determine the final content of the 2021 Census questionnaire.
Consultation process: Overview
The consultation process started in September 2017 and ended in May 2018. It involved an online consultation with all Canadians and face-to-face discussions with federal departments; other organizations; and First Nations, Métis and Inuit stakeholders.
Statistics Canada heard from individuals and organizations in many sectors of Canadian society:
- federal departments
- provincial and territorial ministries and organizations
- municipal governments
- First Nations, Inuit and Métis individuals, leadership and organizations
- non-governmental organizations (NGOs)
- researchers and academia
- businesses
- the general public.
To understand the needs of Indigenous organizations and communities, more than 60 in-person discussions were held in 30 Indigenous and non-Indigenous communities across Canada involving more than 400 contributors.
This report focuses on the findings of the online consultation and stakeholder discussions. Chapter 1 explains whom we consulted. Chapter 2 describes how we assessed information needs, while Chapter 3 focuses on information needs by census topic and reported data gaps. Chapter 4 explains the final steps for determining what content to propose for the 2021 Census questionnaire.
A separate report describing results from extensive discussions with First Nations, Inuit and Métis contributors will be released separately. There will also be a separate report with the findings of consultations on census products.
Start of text box
Feedback on census products
In addition to census questionnaire content, online consultation respondents reported their needs for census data products that are available, but somehow inaccessible or thought to be unavailable. Possible reasons for why data were difficult to find included, but were not limited to, difficulty locating data products on the Statistics Canada website and not knowing about Statistics Canada’s custom tabulation services.
We provided the program areas responsible for census products and data dissemination with information on data availability and accessibility from this consultation. This information will supplement findings from a separate Statistics Canada consultation on the dissemination of 2021 Census of Population data.
End of text box
Chapter 1 – Whom we heard from
Online consultation
Over 2,800 responses were gathered from individuals through online consultation from September 2017 to February 2018. To determine the overall census data needs of an organization (business, government, NGO), multiple responses from organizations were combined. Respondents to the online consultation represented every province and territory and the needs of many sectors (Appendix A).
Anyone interested in sharing their views on census questionnaires was welcome to participate in the online consultation. Over 10,000 known census data users were invited by email to participate and encouraged to share the consultation invitation with others within their network. As a result, two-thirds of respondents were invited to participate through Statistics Canada’s contacts.

Description for Figure 1
2,804 responses were submitted to online consultation from various groups.
- Federal (267 responses)
- Provincial and Territorial (318 responses)
- Municipal (544 responses)
- Indigenous (73 responses)
- Non-Governmental Organizations (342 responses)
- Academic (247 responses)
- Business (163 responses)
- Public (850 responses)
Source: 2021 Census of Population online consultation.
In-person stakeholder discussions
In addition to the online consultation, Statistics Canada met with respondents from 14 federal departments and other interested organizations in person. At these meetings, stakeholders were able to ask about the online responses, provide detailed descriptions of their data needs and ensure their needs were well-understood. Federal departments that took part in these meetings included:
- Agriculture and Agri-Food Canada
- Canada Mortgage and Housing Corporation
- Crown-Indigenous Relations and Northern Affairs Canada
- Department of Canadian Heritage
- Department of Finance Canada
- Employment and Social Development Canada
- Minister of Employment, Workforce Development and Labour
- Minister of Families, Children and Social Development
- Health Canada
- Immigration, Refugees and Citizenship Canada
- Indigenous Services Canada
- Department of National Defence
- Department for Women and Gender Equality
- Treasury Board of Canada Secretariat
- Veterans Affairs Canada.
Regional discussions on Indigenous identification questions
From September 2017 to February 2018, Statistics Canada held a series of discussions across the country. The goal of these discussions was to collect feedback on questions used on the census and other Statistics Canada surveys to identify First Nations people, Métis and Inuit. The last major review of these questions was done in 2007, prior to the 2011 Census.
During these discussions, Statistics Canada’s Social and Aboriginal Statistics Division (SASD) and Aboriginal Liaison Advisors visited 30 locations across the country, conducted about 60 sessions and listened to over 400 people. Leadership and data users from local, provincial, territorial and national Indigenous organizations such as friendship centres, health organizations and communities were contributors in these discussions. Statistics Canada also met with representatives of provincial and territorial governments, federal departments, academics and researchers.
In facilitated discussions, contributors were asked to provide their thoughts and opinions on four census questions used to identify First Nations people, Métis and Inuit, as well as on specific terminology such as “Aboriginal” and “Indigenous.” Contributors were also asked for feedback regarding Statistics Canada’s Aboriginal data products.
An in-depth report entitled “Regional discussion report: Review of First Nations, Métis and Inuit questions on the census” is available and summarizes the feedback received in these meetings.
End of text box
Chapter 2 – Meeting information needs
Overview
The consultations focused primarily on the information needs of data users, as defined by the census evaluation criteria for user requirements (Appendix B). This chapter describes the views of organizations and individuals regarding small geographies and populations of interest, comparability of census data across Canada, continuity of data over time, frequency of data availability, multivariate analysis, the purposes for using census data, and alternative data sources. Tables of findings are available in appendices C to G. Information needs by census topic are covered in Chapter 3.
Small geographies and populations of interest
The census is an excellent way to collect and provide data on small geographies and populations of interest since Statistics Canada’s geographical classification system allows data users to narrow down areas to as small as a blockface. Respondents were asked to identify the lowest level of geography that they or their organization used (Chart 1), as well as the population groups they analyzed, when using census data (Appendix C).
Respondents from all user groups showed great interest in being able to access data for areas with small populations. Overall, about two-thirds of respondents reported that the lowest level of geography they or their organization used was census subdivisions (CSDs) or lower. In fact, CSD was the most common response (21% of respondents), followed by dissemination block or blockface (14% of respondents). Despite strong interest in areas with small populations, this was not the most commonly reported lowest level of geography for all user groups. About one-quarter of federal departments and First Nations, Métis or Inuit respondents stated that national, provincial and territorial geographies met their needs. About one-fifth (21%) of non-governmental organizations (NGOs) indicated that census metropolitan areas (CMAs) and census agglomerations were the smallest areas they analyzed.
Data table for Chart 1
| Percentage of census data users | |
|---|---|
| Canada, Provinces and Territories | 12 |
| Census metropolitan area (CMA) and Census agglomeration (CA) | 14 |
| Census division (CD) | 7 |
| Census subdivision (CSD) | 21 |
| Aggregate dissemination area (ADA) | 2 |
| Census tract (CT) | 11 |
| Dissemination area (DA) | 13 |
| Dissemination block (DB) or blockface | 14 |
| Other | 6 |
| Source: 2021 Census of Population online consultation. | |
Respondents were interested in a variety of population groups, most commonly reporting that they analyze the total Canadian population (66% of respondents), children and youth (55% of respondents) and seniors (50% of respondents). For other population groups, interest varied based on the respondent:
- Indigenous peoples were important to federal departments (69%) and First Nations, Métis or Inuit respondents (97%).
- Language groups were important to provincial or territorial government organizations (68%) and NGOs (55%).
- Immigrants were central to the needs of academics (63%) and businesses (57%).
- Low-income households were noteworthy for municipalities (64%) and First Nations, Métis or Inuit respondents (59%).
Comparability across Canada
Overall, 82% of respondents believed it is important to be able to compare census data across Canada for at least one of their purposes (Appendix D). On the other hand, 18% of respondents placed no importance on the comparability of census data across Canada for any of their purposes.
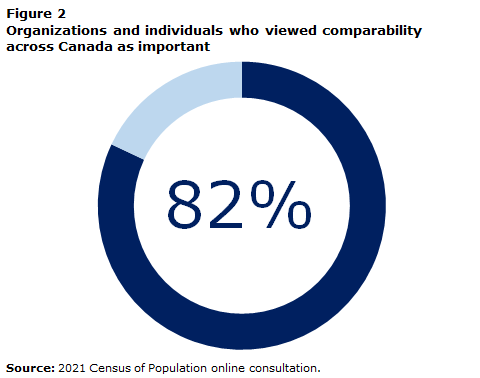
Description for Figure 2
82% of organizations and individuals viewed comparability across Canada as important.
Source: 2021 Census of Population online consultation.
The importance of comparability across Canada varied by the type of respondent. Indigenous respondents (100%), academics (95%) and federal government organizations (94%) expressed the most need to compare data across the country. Some user groups felt less strongly about consistency. For example, respondents from the general public reported the lowest need for national comparisons (70%). Provincial and territorial government organizations (82%) and municipal government organizations (80%) also reported less need for comparability across Canada.
In some cases, organizations or individuals may need to compare specific census topics across Canada. The most important topics to data users for comparing data across Canada included income (82%) and visible minorities (80%). Conversely, household composition (67%), mobility (72%) and activities of daily living (72%) ranked as of lesser importance for comparability across Canada.
Continuity over time
Overall, 93% of respondents felt it is important to be able to compare census data over time for at least some of their purposes (Appendix D). Only 7% of respondents placed no importance on the continuity of census data over time for any of their purposes. Overall, all user groups viewed continuity over time as highly important.
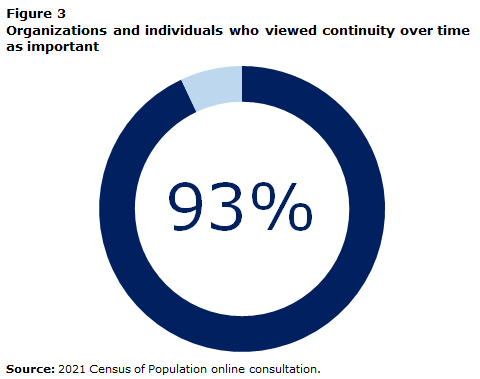
Description for Figure 3
93% of organizations and individuals viewed continuity over time as important.
Source: 2021 Census of Population online consultation.
Respondents did not find continuity over time to be uniformly important across all census topics. For respondents, the least important topics for maintaining the census time series were household composition (81%) and activities of daily living (85%), while the most important topics were income (92%) and visible minorities (91%).
Respondents were asked in general terms which was more important to them or their organization: relevancy (the degree to which census data meet current user needs) or continuity of census data over time. Overall, 49%—or nearly half—of respondents preferred relevant data, compared with 44% of respondents who preferred continuity over time and 7% who had no opinion. NGOs (60%), federal government organizations (56%), and provincial and territorial government organizations (55%) most strongly viewed relevancy of census data as more important than continuity over time. Academics favoured continuity over time more than any other user group (58%).
Frequency of data availability
We asked respondents whether they or their organization preferred the frequency of each question they used from the 2016 Census questionnaire to be every census cycle (5 years) or every second census cycle (10 years) (Appendix D). Overall, 96% of organizations and individuals who used census data preferred them every cycle for at least one of the census questions they used. By this measure, almost every organization and individual from all user groups agreed that census data should be available every 5 years.

Description for Figure 4
96% of organizations and individuals preferred census data every 5 years.
Source: 2021 Census of Population online consultation.
At least 90% of organizations and individuals agreed that census data being available every cycle was preferred for all but two topics: ethnic origin (87%) and religion (82%). Religion is currently the only census topic that is available every 10 years (religion was not a topic on the 2016 Census, but will return in 2021).
Respondents were asked in general terms whether they or their organization would be interested in preliminary population and dwelling counts being available before final counts are released. Almost half of respondents (45%)—typically municipalities interested in the most up-to-date information for budgeting or planning purposes—felt that preliminary counts would be useful. Around one-fifth of respondents (19%) felt final counts were suitable for their purposes, while just over one-third (35%) had no opinion about preliminary estimates.
Multivariate analysis
Multivariate analysis allows users to examine interrelationships across different census questions, such as age, education, income and immigrant status. This type of analysis is possible with the census since data are available for each individual and household.
During consultation, respondents indicated which of the 80 questions collected on the 2016 Census long-form questionnaire they used. The median number of questions used by respondents was 25 (Chart 2 and Appendix E). The number of questions used varied by data user group, from 17 for federal government organizations to 35 for academics. While the consultation did not involve asking the respondent why they used that number of questions, we can assume that how respondents use the full range of data reflects their objective. For example, one data user might narrowly focus on delivering one service to a particular population group, whereas another user may be more broadly concerned with a full range of activities, including planning, delivering services or programs, monitoring and evaluating needs, and running complex models.

Data table for Chart 2
| Median number of census questions used | |
|---|---|
| Federal government | 17 |
| Provincial or Territorial government | 22 |
| Municipal government | 28 |
| Indigenous | 31 |
| Non-governmental organization | 20 |
| Academia | 35 |
| Business | 27 |
| General public | 25 |
| Median | 25 |
| Source: 2021 Census of Population online consultation. | |
While all types of users generally used demography, language, education, labour market activity and income data, there were notable differences among respondent groups. Federal, provincial and territorial government organizations typically used ethnocultural and Indigenous data more than others. Municipal governments frequently used mobility, place of work and housing data. Indigenous data users reported making broad use of all census content, with the exception of ethnocultural questions relating to ethnic origin, visible minorities and religion.
Purpose of data need
Overview
Respondents were asked whether they used census data for the following purposes (Appendix F):
- statutory or regulatory purposes
- resource allocation for programs and policies
- service delivery for programs
- planning, development, monitoring, evaluation and performance reports related to programs and policies
- research or other uses.
Respondents who used data for statutory or regulatory purposes were also asked to identify the specific laws, statutes or regulations.
Statutory and regulatory purposes
Census data were sometimes used to support legislation and regulations. These are the least frequently reported, but most important, uses of the census. Government organizations tended to use the census for purposes tied to law more than other data user groups. In fact, 43% of the federal departments that reported using the census reported using it for at least one statutory or regulatory purpose, compared with 27% of provincial and territorial government organizations and 15% of municipal governments. Among non-governmental organizations, First Nations, Métis or Inuit user groups (34%) and NGOs (13%) most used the census for this purpose.
In all, 345 organizations and individuals listed 95 laws and regulations that they support using census data.
Note: These laws and regulations do not all cite the census—in fact, relatively few do. However, organizations use census data to support legislation.
The census topics most frequently used to support legislation or regulations tended to reflect the most frequently used data overall. Language data, however, stood out as the topic most frequently used for legislative reasons. The Official Languages Act was commonly cited by all levels of government and NGOs. The Canadian Charter of Rights and Freedoms, Section 23 in particular, was specified frequently by provincial and territorial government organizations, including school boards, NGOs and the general public.
Note: Section 23 of the Canadian Charter of Rights and Freedoms guarantees minority language educational rights to French-speaking communities outside Quebec, and to English-speaking minorities in Quebec.
Federal departments used the broadest range of census data to support legislation, particularly demography, language, activities of daily living, Indigenous People, labour and housing data. Respondents in this group cited using the data to support specific pieces of legislation, including the Employment Equity Act, Indian Act and Interpretation Act.
Provincial and territorial government organizations depended on demography, language, activities of daily living, education and housing data the most. They often mentioned acts relating to education, accessibility, employment equity and planning.
Municipalities mostly referred to activities of daily living, place of work and housing data for legislative and regulatory purposes. In fact, housing data accounted for one-quarter of municipal data use for these purposes. Municipalities most often specified zoning, land use and official plans for legislative and regulatory uses. They also commonly cited acts related to accessibility and planning.
Two-thirds of First Nations, Métis or Inuit contributors reported using Indigenous People data for legislative and regulatory purposes, and the Indian Act was most commonly cited.
Private businesses particularly focused on housing data, referring most frequently to zoning, land use and official plans.
Resource allocation for programs and policies
Overall, 41% of organizations and individuals who use the census do so to allocate resources for programs and policies. First Nations, Métis or Inuit (76%) was the user group that reported the highest proportion of this type of use, followed by provincial and territorial government organizations (63%), municipalities (60%) and federal departments (59%). Less than half of the remaining respondents used census data for resource allocation.
The most commonly used census data for resource allocation included data on language, education, labour, income and housing. This tended to be true for all user groups, although businesses used labour data more often than others, while First Nations, Métis or Inuit favoured housing data.
Service delivery for programs
Almost half of organizations and individuals who used census data used them for program service delivery (48%). User groups from certain organizations had greater service delivery needs than others. The user group with the highest proportion of census data users for this purpose was First Nations, Métis or Inuit, at 83%, followed by about 66% of organizations at each level of government and 61% of NGOs. Among the remaining user groups, one-third or less reported service delivery among their uses of the census.
Language, education, labour and housing were the most commonly used census data for service delivery. Again, this tended to be true for all user groups. The general public tended to use language data more frequently for service delivery than other user groups, and housing data were used more by municipalities; businesses; and First Nations, Métis or Inuit.
Planning, development, monitoring, evaluation and performance reports related to programs and policies
The most common reason for using census data among all levels of government (more than 80%) and the First Nations, Métis or Inuit user group (more than 90%) was planning, development, monitoring, evaluation and performance evaluation related to programs and policies. Overall, 6 out of 10 organizations and individuals reported using the census for activities related to these purposes.
Education, labour and housing data were most frequently used to support planning, development, monitoring, evaluation and performance reports related to programs and policies. Municipalities tended to use housing and place of work data more than other user groups, while First Nations, Métis or Inuit and federal government data users found Indigenous People data most important.
Research
With more than 70% of organizations and individuals using the census for research, this was the most common use of census data overall. Almost all academics (94%) and many federal departments (80%) reported using census data for research.
Once again, education, labour and housing data featured prominently in responses. Municipalities and First Nations, Métis or Inuit contributors used housing data somewhat more often for research. Among the general public, demography and place of birth data stood out for their frequent use, reflecting the many responses from genealogists and individuals interested in family history.
Alternative data sources
Administrative data can improve census accuracy and reduce respondent burden. Statistics Canada currently uses administrative data to supplement the census and replace questions that used to appear on the questionnaire. For example, Statistics Canada has replaced detailed income questions with administrative tax data since 2016. Statistics Canada continues to explore new ways to use administrative data.
During consultation, we asked respondents whether they knew of alternative data sources that could provide information similar to that provided by the census. Overall, 470 organizations and individuals reported at least one alternative data source.
A large proportion of the alternative data sources reported were other Statistics Canada surveys, such as the Labour Force Survey, the Canadian Community Health Survey and the Aboriginal Peoples Survey. Another frequently mentioned survey was the Canadian Survey on Disabilities, which is a postcensal survey that uses census content—particularly on the activities of daily living—to create its survey frame.
Other reported alternative data sources include tax data, vital statistics, the Indian Register, land registries, utility information, school registration and various sources of municipal data from municipalities. Statistics Canada is currently exploring many of these datasets, for example, information on utilities, use of the Indian Register, and the expanded use of administrative data holdings from Immigration, Refugees and Citizenship Canada.
Alternative sources must satisfy several factors before they can be considered viable providers of census content. Alternative sources must capture similar concepts as the census, be reliable sources of information on populations and dwellings across Canada, use similar reference periods as the census, be of high quality, and be accessible to Statistics Canada. In fact, in most surveys the census provides the essential benchmark to ground survey responses to the Canadian population.
Chapter 3 – Information needs by topic
Overview
Respondents consulted were asked to report data gaps in the 2016 Census, provide a brief description of why these gaps should be addressed in future census questionnaires and list known alternative sources. Statistics Canada considered all 129 gaps reported by nearly 800 organizations and individuals (Appendix G) and included many as proposals for changes to the 2021 Census. Because most gaps were reported infrequently, only the most notable ones are described in this chapter. This chapter describes user requirements by census topic and provides a high-level summary of which changes were qualitatively tested during cognitive one-on-one interviews, conducted in 2018.
Enumerating households and people
Under the de jure enumeration method used in Canada’s Census of Population, the population is enumerated based on a “usual place of residence,” that is, by the location where a person lives most of the time. Census enumeration involves listing all usual residents of a dwelling on Census Day.
Information gaps
“Keep the data coming!!! I’d love data on full- and part-time populations, but I think you do amazing work!!!”
—Municipal government
End of text boxRelatively few gaps were reported regarding households and dwellings that are covered by the census, and the gaps that were reported came almost exclusively from provincial and municipal governments interested in estimating the floating population (e.g., seasonal residents, people with multiple residences and transient students). In particular, two municipal governments indicated that they would use information on temporary residents for program development and evaluation, such as identifying equity issues for temporary residents and targeting programs toward students.
Qualitative testing
Accurately enumerating Canada’s population is crucial to the census. Some proposed changes were qualitatively tested in 2018 to ensure that residents are correctly enumerated and to decrease double-counting of people with more than one usual residence.
Demography and household composition
These questions provide information about how and with whom people in Canada live: living arrangements, family size, number of children living with one parent or two parents, and number of people who live alone. This information is used to plan social programs such as Old Age Security and the Canada Child Benefit. Municipalities also use it to plan a variety of services, such as daycare centres, schools, police, fire protection and residences for seniors.
Demography questions have always been crucial to the census. In 1871, the first Canadian census collected information on the name, age, sex and marital status of every member of the household. The relationship of the members of the household to “Person 1” (formerly “head of household”) was added to the 1891 Census of Population.
Information gaps
The LGBTQ2 (lesbian, gay, bisexual, transgender, queer, two-spirited) gap was by far the most commonly reported gap, with 136 mentions. It can be broken down into three themes: gender alone, sexual orientation alone, and both gender and sexual orientation. In fact, more than 70% of those who reported this gap referenced gender, and gender alone accounted for half of the requests to include gender in the census.
“Sexual orientation and gender identity are another area of increasing concern where we have little data about the experiences of these populations from an equity viewpoint. Participants frequently mentioned previous censuses have not been inclusive of LGBTQ2 community and that there is a need for the data.”
—Municipal government
End of text boxLGBTQ2 was reported by organizations and individuals from all user groups, but most frequently by the general public (33%), NGOs (22%) and academics (20%). Organizations from all levels of government reported LGBTQ2 in almost equal measure and accounted for about one-quarter of those who expressed an interest in this gap. Nearly all of these government organizations self-identified as census data users, compared with only half of non-governmental organizations and individuals. If the census collected information on the unmeasured portion of the LGBTQ2 population, respondents indicated they would use the data to improve policy and programming, target services, and conduct research.
Other than LGBTQ2, gaps for demography and household composition tended to be reported by genealogists interested in the relationships between household members and marital status. Current content in the census questionnaire on demography and household composition otherwise appears to satisfy the great majority of information needs.
Qualitative testing
In addition to feedback from consultation respondents and stakeholders, there were other factors that led to the decision to test a non-binary gender question: the new federal standard for sex and gender, Bill C-16 (Canadian Human Rights Act) prohibiting discrimination based on gender, and provincial and territorial governments now permitting a person’s sex to be changed to their gender on their birth certificate. Testing a new gender question led Statistics Canada to also modify other questions and response options, such as introducing gender-neutral parent labels in the “place of birth of parents” question.
Language
In 2016, five language questions were used to provide a profile of the linguistic diversity of Canada’s population. This information is used to estimate the need for services in English and French, and to better understand the current state and the evolution of Canada’s various language groups.
Language questions on knowledge of official languages and mother tongue first appeared on the 1901 Census. A question on language spoken at home was added in 1971 and one on knowledge of non-official languages was introduced in 1991. Language used at work was added to the 2001 Census.
Information gaps
The vast majority of language gaps were categorized as either language rights-holders (according to the Canadian Charter of Rights and Freedoms) or language of school instruction (described later in this chapter). The remaining language gaps tended to revolve around official language use, particularly French. These gaps pertained to issues such as the language used in public, language of government services and knowledge of official languages. A sign language gap was identified three times.
Qualitative testing
Focus groups tested a new two-part approach to the mother tongue, language spoken at home and language used at work questions, as well as modified instructions for the mother tongue question indicating that respondents could report multiple responses. New questions were also tested to enumerate children who are language rights-holders.
Activities of daily living
This question provides information on the number of people in Canada who may have difficulties doing certain activities, including those who may have a long-term physical, mental or other health condition. This information is used to identify people who are likely to have a disability. Statistics Canada then follows up with a more detailed survey.
The 1871 Census of Population and subsequent censuses collected information on infirmities. Questions on activity limitations first appeared on the 1986 Census.
Information gaps
“More information on the type of disabilities Canadians identify as having and where they are located is useful to fulfilling our mandate in providing relevant programming nationally.”
—Business
End of text boxRespondents frequently reported wanting detailed information about people with disabilities, such as children with special needs, people living with chronic pain, experiences of the disabled at work, housing and school. Disabilities differs somewhat from the census’ concept of activities of daily living, which focuses on the difficulty performing everyday activities because of long-term conditions expected to last longer than six months. Statistics Canada’s Canadian Survey on Disability uses census information to screen individuals for a postcensal survey of people with disabilities that seeks information on the type and severity of disabilities experienced by Canadians.
Qualitative testing
No changes to the activities of daily living questions were proposed for testing. However, a new self-reported health question was tested.
Immigration and Citizenship
Questions on the place of birth of household members and their parents provide information about the diversity of Canada’s population and the movement of people within Canada and from other countries to Canada. They are used to assess the social and economic conditions of second-generation Canadians and help to understand Canada’s immigration history.
Place of birth was first collected on the 1871 Census. A question on parents’ place of birth was added in 1891. Citizenship and year of immigration questions were first collected in the 1901 Census, and a question on landed immigrant status was first asked in 1991.
The 2016 citizenship question provides information on the legal citizenship status of Canada’s population. This information is used to estimate the number of potential voters and to plan citizenship classes and programs. This question also provides information about the population with multiple citizenships and the number of immigrants in Canada who hold Canadian citizenship.
The information gathered from immigration questions is used to compare the social and economic conditions of immigrants over time; to evaluate immigration and employment policies and programs; and to plan education, health and other services.
Since the 2016 Census, Statistics Canada has supplemented the immigration questions with administrative data. Using administrative data not only reduces collection costs and the burden on Canadians, but it also provides more accurate information on immigration and additional questions, such as admission category.
Information gaps
In all, there were just over a dozen references to gaps concerning immigration and citizenship—split almost evenly among government and non-government respondents. Non-government respondents tended to be interested in questions about ancestry, such as the precise place of birth of those born outside Canada and the place of birth of grandparents. Government respondents were more focused on the motivations and details of immigration to Canada, such as ports of arrival, where immigrants landed and why, retention of immigrants by province and territory, and year of arrival (rather than the year they became a permanent resident).
Qualitative testing
Statistics Canada tested modifications to census questions on citizenship, immigration and parents’ place of birth. We are also researching whether immigrant status and year of immigration questions can be replaced by administrative data.
Ethnic origin and population group
The ethnic origin question provides information about ethnic and cultural diversity in Canada. Associations, agencies and researchers use this information for activities such as health promotion, communications and social support programs. Governments, businesses, community groups, health care providers, researchers and a variety of organizations throughout the country use the data from the population group question to support programs that provide equal opportunity for everyone to share in the social, cultural and economic life of Canada. This question supports the Employment Equity Act with an estimate of the visible minority population.
Ethnic origin was first collected on the 1871 Census. A “racial origin” question first appeared on the 1901 Census. The population group question (collecting information on groups specified in the Employment Equity Act) first appeared in the 1996 Census.
Information gaps
Respondents reported some ethnic origin and population group gaps, and were generally interested in either ethnic origin and population group questions being placed on the census short form, or concepts of ethnocultural discrimination being introduced to census content. Concerns were raised about the examples provided for these questions and their impact on responses. Some researchers reported having difficulty interpreting some of the ethnicity groupings presented in standard census products. This is not an issue with the questionnaire, since respondents report their ethnicities in their own words.
Qualitative testing
Based on input from Canadians and experts, the list of examples provided in a question can have a significant effect on response patterns. Statistics Canada tested changes to the list of ethnic origin examples, as well as a different version of the population group question.
Indigenous peoples
These questions provide information used by governments, including First Nations, Métis and Inuit governments and organizations, to develop programs and services for First Nations people, Métis and Inuit.
Questions on Registered or Treaty Indian status and membership in a First Nation or Indian band first appeared in the 1991 Census. A separate question on Aboriginal identity first appeared in the 1996 Census. In earlier censuses, some information was collected on Indigenous People: the 1911 Census had a question about “racial or tribal origin” and the 1951 Census had a response category for “Native Indian” in the ethnic origin question.
Information gaps
While the Census of Population gathers basic information from collective dwellings, it does not currently collect detailed characteristics on residents of collectives. Identifying Indigenous populations in collective dwellings was particularly important for one federal department, which noted that information on Indigenous residents of nursing homes, hospitals, military bases, prisons or other collective dwellings was important for research to support and develop economic development policies and programs.
“Métis are a distinct Aboriginal group federally recognized but they are not covered in the questions.”
—Indigenous organization
End of text boxRespondents indicated that the Indigenous identity question needs to be improved in order to identify distinct Indigenous populations. More precise data could be combined with survey data to determine the housing needs of Indigenous people living off-reserve. This information would be used to inform policies, programs and services for off-reserve Status and non-Status Indians, Métis and Inuit.
The areas of primary interest for Indigenous respondents centred on Treaty status, health and culture. Suggestions included more detailed information on Treaty status and physical and mental health conditions of Indigenous peoples. Indigenous health data would be used with data from regional health surveys, the Aboriginal Peoples Survey and Vital Statistics data to monitor and evaluate Indigenous health outcomes.
Both a Métis organization and a federal department indicated a need for enhanced information on the Métis population. This information would reportedly be combined with the Métis Registry to track the heritage and migration of Métis families.
One federal department indicated a variety of data gaps pertaining to housing on reserves: shelter costs, the presence of mould, the source of heating and the quality of potable water. The department stated that accurate data were necessary to advocate for funding and action on infrastructure needs.
Qualitative testing
Content changes were tested qualitatively to address updated terminology and land claims agreements. Statistics Canada tested the addition of new Métis and Inuit questions.
Religion
This question provides information about religious affiliation and diversity. This information is used to help understand changes in Canadian society, as well as to plan facilities and services within diverse communities. The religion question is asked every 10 years and will be included in the 2021 Census.
Religion data were first collected in the 1871 Census of Population.
Information gaps
“Thank you for taking my opinions into account. We would REALLY like to see the Religion question asked every cycle.”
—Non-governmental organization
End of text boxReligion gaps were most commonly reported by academics and the general public with an interest in religious attendance or participation and affiliation with religious groups. Another religion gap is related to the frequency of census religion data, which are currently collected only every 10 years. A request for more frequent religion data was echoed during in-person meetings with federal stakeholders, who explained that Canada’s religious landscape is continually evolving. Having these data available every census cycle would allow government organizations, policy analysts and researchers to better understand these changes and impacts on social and economic issues, as well as to support the anti-Islamophobia motion (Bill M-103). The increasing rate of change in Canadian diversity is also being closely monitored by federal committees.
Qualitative testing
As with the ethnic origin question, the religion question has historically offered a list of examples. We tested both changes to the listed examples of religions and a religion question.
Mobility
These questions tell us where residents of Canada are moving to and where they are moving from. This information is used to identify the characteristics of people who move and their needs in housing, education, health, transportation and social services.
A person’s place of residence five years ago was first collected on the 1961 Census, and the question on place of residence one year ago was added to the 1991 Census.
Information gaps
“Reason for mobility is to better understand what is driving people to leave sub regions and how best to understand the factors that are top of mind for people.”
—Municipal government
End of text boxOrganizations and individuals who reported a gap in mobility data were most commonly interested in the reasons for moving. They wanted to know about issues that influenced the decision to move and factors Canadians considered when choosing their new location of residence. A minority of respondents were interested in Canadians’ intentions to move.
Qualitative testing
We tested proposed changes to mobility questions to capture more detailed address information.
Education
These questions provide information on the education, training and recent school attendance of residents of Canada. Governments use this information to develop training and other programs to meet the changing needs of the workforce and specific groups such as immigrants, First Nations people, Métis, Inuit and youth.
The 1871 Census collected information on school attendance. In 1941, a question was added about the highest grade of elementary or secondary schooling attained. More education questions were added in 1961 (e.g., highest level of schooling; highest certificate, diploma or degree; and years of university schooling).
Information gaps
Among gaps reported for census content related to education, two themes stood out: educational attainment (specifically, years of schooling) and pathways to education.
Several NGOs in the education field and two federal departments suggested that the census should capture the pathways taken toward achieving educational credentials. Specifically, they asked for information on the most recent educational credential completed, the date of completion for credentials, and the field and location of study. One federal department identified the need for information on financing of studies and online education.
“We currently use census data to create socioeconomic status indicators in support of analysis of various impacts on education achievement and outcomes. We use it as drivers/components in various statistical data analysis, which supports evidence-based decision making.”
—Provincial government
End of text boxRegarding years of schooling, the census collected this information prior to 2006, but these questions were removed at the request of stakeholders who wished to focus on more detailed educational attainment (i.e., expanded questions on trades and college). Another comment was that bachelor’s degrees earned from colleges are not separately identified by the census. This was reported as important since these are becoming more common and of increasing interest to stakeholders.
Qualitative testing
New and modified education questions were tested to take into account changes in postsecondary education, particularly around college education. New education questions were added for the most recent credential, associated field and location of study, year of completion, and digital skills. Existing education content was modified to align with current terminology, reduce respondent burden and ensure data accuracy.
Labour market activity and journey to work
Questions about labour market activity provide information on Canada’s workforce, including the industries and occupations people work in, as well as the language or languages used at work. Employment information is used to assess the economic conditions of communities and specific populations, such as Indigenous peoples and immigrants. Industry and occupation information is used to forecast job opportunities.
In 1871, the census collected a person’s occupation. A question on class of worker was added in 1891, and the person’s industry was first asked in 1901. Usual hours worked each week and weeks worked in the reference year were first asked in 1911. Starting in 1951, other labour questions were added (e.g., actual hours worked last week).
Journey to work questions tell us where people work and how they get to work. This information is used to assess commuting patterns, public transit needs and energy use. Commuting information also helps to identify locations for new hospitals, schools, and daycare and recreational facilities, as well as the need for roads and other travel networks.
Information gaps
Overall, labour was the topic with the most reported data gaps and accounted for 25% of all gaps reported by government organizations.
“In a nutshell, the census for us is a source for employment data that is more detailed than LFS in terms of geography, industry and occupation.”
—Provincial/Territorial government
End of text box To make labour content on the census more relevant, some respondents suggested including the reasons for part-time work and data on unpaid work, hourly wages and multiple modes of transportation to work. Program managers and policy analysts at various federal departments would use these data to meet their mandate, support the Gender Equality Framework, examine barriers to employment and provide timely reporting on vulnerability groups.
Unpaid work was the dominant theme under labour gaps. The 39 organizations or individuals that suggested this gap mostly agreed that responses for unpaid work should be activity-based. Respondents most often specified a desire for data on care for children and the elderly, housework, and volunteerism. Fewer respondents sought data on Canadians who support others with chronic illnesses, the disabled or other dependants. The General Social Survey provides a more robust and comprehensive measurement of unpaid work and household activities than previous censuses that asked a question on unpaid work.
“As more women work in well-paying jobs, how does that impact their traditional role of caregiver for children and aging parents, and cooking/cleaning/etc. Who’s doing it, instead? How is it impacting women’s health, stress?”
—Federal government
End of text boxProvincial and municipal governments were highly interested in expanded place of work data. Among all user groups, respondents broadly agreed that place of work content should include more information on mode of travel to and from work. Specifically, respondents wanted new data on transportation options and preferred modes of travel, as well as more information on multimodal travel, including time and distance travelled by each mode. Information on active transportation was an area of interest to three large municipalities, while one national association with a focus on urban transit wanted improved data on mixed modes of travel. Less common gaps cited for place of work data included car ownership, household expenses for travel to work and a measurement of the daytime population. Daytime population, in contrast to resident population, is a concept referring to the number of people, including workers, present in an area during normal business hours.
To a much lesser extent, underemployment and occupation were information needs among respondents. For underemployment, respondents commonly sought enumeration of multiple job holders, including those in the gig economy. For occupation, one federal department expressed a need for more information on fishers, and some stakeholders sought information on the interactive digital media industry, cultural workers and artists. Artists and cultural workers would not be identified as such on the census if they did not report these as their main occupations.
Qualitative testing
Proposed changes to labour content aimed at increasing census relevance by better capturing labour market experiences such as underemployment, involuntary part-time work and long commutes, as well as changes to work brought on by the digital economy. Gathering more complete information on Canadians’ journeys to work was tested by adding a question about all modes of transportation that a person used during their typical commute.
Income and expenses
Since the 2016 Census, Statistics Canada has fully replaced the detailed income questions on the census questionnaire with administrative data. Using administrative data not only reduces collection costs and the burden on Canadians, but also provides more accurate information on income.
The census questionnaire collects information on expenses related to child care and support payments. Along with the income information collected from income tax and benefit administrative records, these questions help provide more precise measures of disposable income.
The 1901 Census collected information on wages and salaries. In 1961, many income questions were added to the census (e.g., income in previous year and benefits from employment insurance).
Information gaps
Consultation respondents were highly interested in three income-related gaps, reported in almost equal frequency: wealth and debt, poverty, and spending.
Almost 8 out of 10 mentions of the wealth and debt gaps were made by the general public (29%), academics (29%) and municipal governments (21%). Regarding assets, respondents would like to see the value of household real estate, the value of physical belongings and investments included on the census. For liabilities, many respondents described a need to measure mortgage balances and home equity lines of credit, among other debts. One academic offered access to food, shelter, water, education, the Internet, culture and nature as a measure of wealth. Another data user stated that information on wealth and debt would help to deepen the understanding of which factors affect disparities between populations.
Food security was referenced in descriptions of a reported poverty gap. While one respondent stated that data on food security could be used as a measure of poverty, another claimed they would support advocacy for resources and programs to improve food security for Canadians in need. One non-governmental organization suggested approximately five questions could be used to properly measure food security. Other examples of a poverty gap included information on the working poor, economic security and children living in poverty.
Suggestions that the census should gather information on household spending came primarily from government organizations and academics. They indicated a need for information associated with the cost of living (e.g., food, transportation and household items) and discretionary spending. One municipal government respondent felt this information would benefit program planning and service delivery. One private business suggested that consumer demographics could be used to forecast growth and develop business opportunities.
Qualitative testing
Statistics Canada continues to explore the possibility of replacing questions on child care expenses and support payments with other data sources. After examining the data gaps described during consultation, we concluded that the census was not a suitable vehicle for gathering information on wealth, debt, poverty and spending. These concepts are too complex for the census to accurately measure without imposing significant respondent burden. There are other sources for this information, such as the Survey of Household Spending and Survey of Financial Security.
Housing
These questions provide information used to develop housing communities and projects. Information on housing costs and the number of rooms and bedrooms in homes is used to assess crowding levels within dwellings and housing affordability. Such indicators are used by many organizations to help develop housing programs supporting the housing needs of Canadians. Municipalities use information on the age of dwellings and the need for repairs to develop neighbourhood improvement programs.
Housing characteristics were first collected in the 1941 Census.
Information gaps
As with labour market activity, respondents reported many data gaps for housing, particularly regarding collective dwellings, homelessness and dwelling characteristics.
“We use census data to help determine the types of housing that should be built, the effectiveness of our economic development strategy, preparing for aging population and identifying demographic trends.
The census is one of our most valuable planning tools.”
—Other user
End of text boxGovernments and NGOs expressed the most interest in housing data for vulnerable populations, commonly proposing enumeration of the homeless population and an individual’s history of homelessness. Data users stated that these data would be combined with income data and lists of social and affordable housing addresses for research, planning and allocating resources. It was suggested that the census could also collect information on people in precarious housing situations, that is, those at risk of becoming homeless.
Data needs for collective dwellings differed substantially between the general public and government organizations. Gaps from government respondents touched on populations residing in collective dwellings such as students, people with disabilities and youth. The information needs of the general public were focused primarily on the aging population, which in some cases would require gathering information from Canadians before they leave their homes for a retirement residence or nursing home. It was argued that Canada must ensure that services and resources are available to meet the needs of an aging population. Collecting information on a person’s intention to stay in their home as they age, where they plan to retire to and how close they are to moving into a retirement community would reportedly help with economic development plans.
Gaps relating to dwelling characteristics covered a wide variety of requests, including square footage, construction materials, the presence of a basement and short-term rentals of private dwellings (e.g., Airbnb). Reportedly, data on construction materials and the presence of basements would be used to inform planning and housing development in geographic areas with a higher risk of natural disasters. Information on the square footage of dwellings would be used to assess the diverse types of housing needed in urban and rural areas. Finally, one organization wanted to analyze the supply and demand conditions of short-term rentals in private dwellings.
Qualitative testing
Statistics Canada is exploring the possibility of replacing some housing questions on the amount paid for electricity, dwelling subsidy information and assessed value with other data sources. There is ongoing work to explore how administrative data can be used to fill other identified data gaps, including collective dwellings.
Proposed new question: Veterans
This question provides information on the number of people with Canadian military experience. Governments will use this information to develop programs and services to meet the changing needs of the veteran population.
The Census of Population first collected information on wartime service in 1951. Wartime service information was collected again in 1961 and last collected in 1971.
Information gaps
“It is important for us to have the ability to compare our Veterans with the rest of the Canadian population so that gaps can be filled in programs and benefits and that trends can be identified to assist in policy and procedures development.”
—Federal government
End of text boxMany organizations expressed an information need for content on veterans to meet service delivery needs. These information needs could reportedly be satisfied by including a question in the census that identifies all individuals who ever served in the Canadian Armed Forces. The census last identified the veteran population in 1971. Collecting these data on the census would allow the federal government to create a registry of veterans, which would reportedly ensure that veterans and their families had access to care, treatment, and other programs and services.
Qualitative testing
Statistics Canada tested a veteran question. Federal stakeholders suggested the question be included only on the 2021 Census questionnaire, after which the registry of veterans could be updated using administrative data sources.
Proposed new questions: Language rights-holders and language of instruction
New questions were suggested to collect information on the children of rights-holders to support education programs in English and French across Canada.
Information gaps
“These consultations are important. The Census Program is an essential and very high quality tool to support sound public administration decisions. The status of rights holders is very important for the education sector in a minority setting.”
—Provincial/Territorial government
End of text boxA frequently reported gap was the enumeration of language rights-holders—people who qualify under Section 23 of the Canadian Charter of Rights and Freedoms to have their children educated in the minority official language in their province or territory of residence. This gap garnered the support of 105 organizations and individuals, mainly the general public (64%) and provincial and territorial organizations, typically school boards (22%). Respondents did not report any alternative sources of information that could better identify the number of children eligible to be educated in the minority official language in their province or territory of residence.
Another commonly reported gap related to language rights-holders was capturing the language of primary and secondary school instruction. Among respondents, 38 organizations and individuals expressed interest in the language of school instruction. No alternative sources for this information were reported that could satisfy these data needs. Respondents said that if these data were available, French school boards, provincial and territorial governments, Francophone parents, and communities would be better able to plan educational programs in response to Section 23 of the Canadian Charter of Rights and Freedoms.
Qualitative testing
“Statistics Canada will examine and test potential questions for inclusion in the census to identify rights-holders as part of the process to develop the content for the 2021 Census.”
—Government response to House of Commons report
End of text boxThe respondents’ and federal stakeholders’ suggestion for the census questionnaire to collect information on the children of language rights-holders and language of instruction was supported by the government’s response to the Report of the Standing Committee on Official Languages, The Enumeration of Rights-Holders Under Section 23 of the Canadian Charter of Rights and Freedoms: Toward a Census that Supports the Charter. Qualitative testing included a series of questions designed to identify children whose parents have the constitutional right under Section 23 of the Canadian Charter of Rights and Freedoms to have their children receive their primary and secondary education in French schools outside Quebec or in English schools inside Quebec, as well as to better plan educational programs to serve the needs of rights-holder parents. A new language advisory committee of experts in this field will guide Statistics Canada on this content.
Proposed new question: General health status
This new question collects information on the health status of people in Canada to help plan policies, programs and services for the health care system. General health is an indicator of overall health status and refers to a person’s health in general, as perceived by either the person or the person in the household completing the census.
Information gaps
“Self-reported health is a very robust health indicator that is correlated with many other health indicators. It would provide robust health indicators at a very fine geographical level and for rare populations. It would therefore improve significantly ‘Small area estimates’ for other health indicators. It would allow us to assess non-response biases for health surveys where response rates are declining.”
—Federal government
End of text boxGeneral health, which is not currently part of the Census of Population, was the third most frequently reported gap. General health questions were suggested by 49 organizations and individuals, 70% of which were from non-government sectors. These data would be combined with Vital Statistics, cancer data and hospitalization records to provide community-level health indicators for specific populations, such as immigrants, Indigenous groups and the elderly. Furthermore, these data would be used to plan and deliver local health services across the country.
Qualitative testing
Self-reported health is highly correlated with a person’s actual health and is a strong predictor of a community’s health service needs. Statistics Canada tested a self-reported health question, similar to the one used by the United Kingdom’s Office for National Statistics. It is a simple, highly relevant and validated question that could be very valuable for health service delivery, resource allocation, monitoring and evaluation.Chapter 4 – Next steps
The consultation described in this report assesses Canadians’ information needs for the 2021 Census of Population. Statistics Canada found that most information needs are satisfied by existing census content, but changes could be made to further improve its relevance. We are evaluating opportunities to minimize the burden of completing census questionnaires by replacing content with administrative data, as has been done in the past with income and immigration data. Respondents identified many alternative data sources during consultation. Statistics Canada has evaluated all data gaps reported by consultation respondents and is considering including some new content for the 2019 Census Test. However, not all gaps can be satisfied by the census; another data source may be a more suitable vehicle for some information.
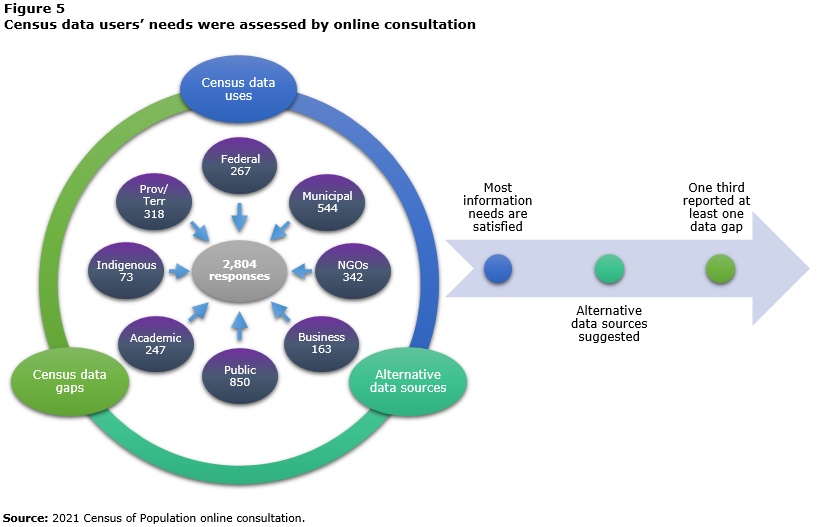
Description for Figure 5
Online consultation assessed census data uses, census data gaps and alternative data sources.
In all, 2,804 responses were submitted to online consultation from various groups.
- Federal (267 responses)
- Provincial and Territorial (318 responses)
- Municipal (544 responses)
- Indigenous (73 responses)
- Non-Governmental Organizations (342 responses)
- Academic (247 responses)
- Business (163 responses)
- Public (850 responses)
Online consultation found most information needs are satisfied, one third of respondents reported at least one data gap, and suggestions of alternative data sources were gathered.
Source: 2021 Census of Population online consultation.
Based on the consultation results, Statistics Canada has modified census questions and begun testing the changes. Through cognitive one-on-one interviews in 2018, Statistics Canada collected feedback from Canadians about possible changes to the census questions. The feedback from qualitative testing determined questions that will be tested quantitatively with 250,000 households during the 2019 Census Test.
The most notable changes proposed for the 2019 Census Test include the following:
Sex and gender: The test questionnaire now includes the more precise term “sex at birth,” and a new question about gender, to collect information on the gender identities of people in Canada and improve policy planning and programs.
Veterans: A new question has been added to provide accurate information about the number of respondents who have served or are serving in the Canadian military. The veteran population was last identified by the census in 1971.
Language and minority language of rights-holders: New questions have been added to better identify the number of children eligible to be educated in the minority official language in their province or territory of residence. The questions for mother tongue and languages spoken at home and at work were revised to decrease respondent burden and question redundancy, and to better capture multiple responses.
Health: A question on general health status has been added to the census test questionnaire to collect information on the health status of people in Canada.
Indigenous peoples: A few modifications were applied. The term “Aboriginal” has been replaced with “Indigenous” to reflect current terminology. More emphasis will be placed on a distinctions-based approach, where people will be able to identify as First Nations, Métis and Inuit. A new question has been added that asks respondents whether they are members of a Métis organization or citizens of a Métis government to better understand the specific needs of Métis across Canada. Another new question has been added that asks respondents whether they are enrolled in, or beneficiaries of, an Inuit land claims agreement.
Education: New and modified education content (questions on the most recent credential, its associated field and location of study, year of completion, and digital skills) has been added to the census test questionnaire to increase relevance and respond to the emerging and evolving Canadian education system and information needs of Canadians, and to gain a better understanding of educational pathways and the associated labour market outcomes.
Labour and journey to work: New questions on reasons for not looking for work and on workers older than 60 years old have been added and questions on employment status have been revised to provide background on why certain population segments are engaged, or disengaged, in the workforce, and to collect information about various employment statuses to better understand labour market dynamics. A new question that captures detailed information on modes of transportation was added and a question that includes all commuting situations was modified to provide more granular information on commuting times and modes.
Ethnic origin, population groups and religion: New versions of the ethnic/cultural origin and population group questions are included to collect information on ethnic and cultural diversity in Canada, provide access to a comprehensive list of examples of ethnic/cultural origins, and provide estimates of the visible minority population in support of the Employment Equity Act. The religion question, typically collected every 10 years, will be included in the test. The list of examples of religions has been modified to improve coherence and collect information on religious affiliations and diversity that is representative of the Canadian population.
Immigration and citizenship: Updated gender-neutral terminology will be used for the parents’ place(s) of birth question. For immigration data, we will continue to evaluate the use of administrative data as a way to include more detailed information.
The 2019 Census Test will allow Statistics Canada to statistically evaluate new and modified questions, as well as the collection procedures and tools to be used for the 2021 Census.
Determining the final content of the census questionnaire includes carefully examining and evaluating many criteria. Before submitting final recommendations for the 2021 Census, Statistics Canada must also assess the following important factors related to the Canadian context and its statistical programs:
- the ability to generate quality data
- the burden on Canadians
- privacy concerns
- the sensitivity of questions
- operational feasibility
- costs.
Following the results of the 2019 Census Test, Statistics Canada will submit recommendations to the Government of Canada regarding the content of the 2021 Census of Population. The government will determine final 2021 Census questionnaire content through an Order in Council, after which the content will be published in the Canada Gazette before being used for 2021 Census collection.
Appendix A – Distribution of responses to the 2021 Census online consultation
| Province or Territory | Responses |
|---|---|
| Newfoundland and Labrador | 101 |
| Prince Edward Island | 41 |
| Nova Scotia | 77 |
| New Brunswick | 88 |
| Quebec | 372 |
| Ontario | 1,145 |
| Manitoba | 163 |
| Saskatchewan | 110 |
| Alberta | 324 |
| British Columbia | 316 |
| Yukon | 20 |
| Northwest Territories | 16 |
| Nunavut | 25 |
| Unspecified | 6 |
| Total | 2,804 |
| Source: 2021 Census of Population online consultation. | |
| Respondent type | Individual Respondents | Grouped by Organization | ||
|---|---|---|---|---|
| Total responses | Self-identified data users | Total responses | Self-identified data users | |
| Federal government | 267 | 156 | 71 | 49 |
| Provincial or Territorial government | 318 | 269 | 196 | 180 |
| Municipal government | 544 | 406 | 436 | 322 |
| First Nations, Métis or Inuit | 73 | 31 | 70 | 29 |
| Non-governmental organization | 342 | 260 | 304 | 231 |
| Academia | 247 | 191 | 247 | 191 |
| Business | 163 | 97 | 159 | 94 |
| General public | 850 | 298 | 850 | 298 |
| Total | 2,804 | 1,708 | 2,333 | 1,394 |
| Source: 2021 Census of Population online consultation. | ||||
Appendix B – Census of Population evaluation criteria for user requirements
There are three main steps in the evaluation criteria. For each step, content is evaluated against specific dimensions.
| Steps | Dimensions | |
|---|---|---|
| Step 1: Census Program information needs (relevance and quality requirements of users) |
• purpose | |
| • small geographies and populations of interest | ||
| • alternative data sources | ||
| • multivariate analysis Table B.1 Note 1 | ||
| • comparability across Canada | ||
| • continuity over time | ||
| • frequency of data availability | ||
| Step 2: Canadian context | • respondent burden | Balance of topics |
| • societal privacy concerns | ||
| Step 3: Statistics Canada considerations | • costs | |
| • operational factors | ||
| • safeguards against loss of Census Program data quality | ||
| • safeguards against loss of efficiency and/or quality in other Statistics Canada programs | ||
|
||
Appendix C – Small geographies and populations of interest
| Respondent type | Canada, Provinces and Territories | Census metropolitan area (CMA) and Census agglomeration (CA) | Census division (CD) | Census subdivision (CSD) | Aggregate dissemination area (ADA) | Census tract (CT) | Dissemination area (DA) | Dissemination block (DB) or blockface | Other | Total Table C.1 Note 1 | |
|---|---|---|---|---|---|---|---|---|---|---|---|
| percent of data users | percent | number | |||||||||
| Federal government | 22 | 20 | 2 | 14 | 2 | 6 | 12 | 18 | 2 | 100 | 49 |
| Provincial or Territorial government | 7 | 11 | 9 | 26 | 3 | 6 | 21 | 12 | 6 | 100 | 180 |
| Municipal government | 12 | 8 | 6 | 24 | 1 | 9 | 18 | 15 | 7 | 100 | 318 |
| First Nations, Métis or Inuit | 28 | 14 | 3 | 10 | 7 | 14 | 10 | 7 | 7 | 100 | 29 |
| Non-governmental organization | 13 | 21 | 10 | 20 | 2 | 8 | 8 | 16 | 3 | 100 | 230 |
| Academia | 8 | 14 | 8 | 16 | 3 | 17 | 19 | 13 | 3 | 100 | 191 |
| Business | 11 | 13 | 9 | 21 | 2 | 11 | 13 | 15 | 6 | 100 | 94 |
| General public | 15 | 15 | 5 | 19 | 3 | 14 | 5 | 13 | 10 | 100 | 297 |
| Overall | 12 | 14 | 7 | 21 | 2 | 11 | 13 | 14 | 6 | 100 | 1,388 |
|
|||||||||||
| Respondent type | Data Users | Total Canadian Population | Indigenous Peoples | Ethnic groups | Language groups | Visible minorities | Immigrants | Seniors | Children or youth | Students | Low income households | Other groups |
|---|---|---|---|---|---|---|---|---|---|---|---|---|
| number | percent that reported the group is of interest | |||||||||||
| Federal government | 49 | 94 | 69 | 61 | 67 | 59 | 57 | 57 | 59 | 57 | 53 | 49 |
| Provincial or Territorial government | 180 | 65 | 55 | 46 | 68 | 44 | 58 | 53 | 73 | 56 | 59 | 43 |
| Municipal government | 322 | 60 | 36 | 38 | 43 | 33 | 47 | 80 | 77 | 55 | 64 | 28 |
| First Nations, Métis or Inuit | 29 | 59 | 97 | 7 | 41 | 10 | 3 | 55 | 72 | 52 | 59 | 10 |
| Non-governmental organization | 231 | 57 | 40 | 41 | 55 | 39 | 52 | 42 | 56 | 40 | 43 | 38 |
| Academia | 191 | 83 | 55 | 63 | 51 | 57 | 63 | 43 | 50 | 43 | 54 | 27 |
| Business | 94 | 81 | 39 | 45 | 43 | 43 | 57 | 56 | 50 | 52 | 53 | 38 |
| General public | 298 | 59 | 19 | 27 | 28 | 18 | 29 | 22 | 22 | 18 | 21 | 31 |
| Total | 1,394 | 66 | 41 | 41 | 47 | 36 | 48 | 50 | 55 | 43 | 48 | 33 |
| Source: 2021 Census of Population online consultation. | ||||||||||||
Appendix D – Comparability across Canada, continuity over time and frequency of data availability
| Respondent type | Comparability across Canada is important | Continuity over time is important | Data required each census cycle |
|---|---|---|---|
| percent | |||
| Federal government | 94 | 96 | 96 |
| Provincial or Territorial government | 82 | 96 | 100 |
| Municipal government | 80 | 92 | 98 |
| First Nations, Métis or Inuit | 100 | 100 | 100 |
| Non-governmental organization | 86 | 93 | 99 |
| Academia | 95 | 98 | 97 |
| Business | 87 | 97 | 100 |
| General public | 70 | 87 | 88 |
| Total | 82 | 93 | 96 |
| Source: 2021 Census of Population online consultation. | |||
Appendix E – Multivariate analysis
| Respondent type | Median number of census variables used |
|---|---|
| Federal government | 17 |
| Provincial or Territorial government | 22 |
| Municipal government | 28 |
| Indigenous | 31 |
| Non-governmental organization | 20 |
| Academia | 35 |
| Business | 27 |
| General public | 25 |
| Median | 25 |
| Source: 2021 Census of Population online consultation. | |
Appendix F – Purpose of data need
| Respondent type | Data Users | Statutory / Regulatory | Resource allocation | Service delivery | Planning | Research | |||||
|---|---|---|---|---|---|---|---|---|---|---|---|
| number | number | percent | number | percent | number | percent | number | percent | number | percent | |
| Federal government | 49 | 21 | 43 | 29 | 59 | 33 | 67 | 40 | 82 | 39 | 80 |
| Provincial or Territorial government | 180 | 48 | 27 | 114 | 63 | 120 | 67 | 154 | 86 | 122 | 68 |
| Municipal government | 322 | 48 | 15 | 192 | 60 | 213 | 66 | 278 | 86 | 182 | 57 |
| First Nations, Métis or Inuit | 29 | 10 | 34 | 22 | 76 | 24 | 83 | 27 | 93 | 22 | 76 |
| Non-governmental organization | 231 | 30 | 13 | 110 | 48 | 141 | 61 | 158 | 68 | 158 | 68 |
| Academia | 191 | 3 | 2 | 30 | 16 | 43 | 23 | 66 | 35 | 179 | 94 |
| Business | 94 | 6 | 6 | 23 | 24 | 31 | 33 | 60 | 64 | 68 | 72 |
| General public | 298 | 22 | 7 | 53 | 18 | 71 | 24 | 79 | 27 | 214 | 72 |
| All | 1,394 | 188 | 13 | 573 | 41 | 676 | 48 | 862 | 62 | 984 | 71 |
| Source: 2021 Census of Population online consultation. | |||||||||||
Appendix G – Data gaps reported during online consultation
The 2021 Census of Population online consultation asked respondents to list up to five data gaps in the census that they felt should be addressed. In all, 129 gaps were reported by nearly 800 organizations and individuals. The table below groups these gaps by topic. A gap can indicate either insufficient existing content (e.g., relationship to Person 1, marital status, education) or new proposed content (e.g., LGBTQ2, rights-holders). For example, gaps under “marital status” included respondent requests for the census to include information on the number of times a person has been married, or the year and place of marriage. Gaps in “relationship to Person 1” included suggestions that the census should capture information on step-families.
| Topic | Data gap | Frequency reported |
|---|---|---|
| Existing Census topics | ||
| Coverage | Secondary residence | 8 |
| Other | 4 | |
| Temporary residents | 2 | |
| Demography | LGBTQ2+ (lesbian, gay, bisexual, transgender, queer, two-spirit) | 136 |
| Relationship to Person 1 | 21 | |
| Marital status | 12 | |
| Name | 4 | |
| Other | 1 | |
| Language | Rights-holders | 104 |
| Language of primary or secondary instruction | 38 | |
| Language used: public sphere, communication, etc. | 8 | |
| Language Rights - Services | 5 | |
| Language - General | 4 | |
| Official Languages Minorities | 4 | |
| Sign Language | 3 | |
| Education | 3 | |
| Official Language Knowledge | 3 | |
| Francophonie | 2 | |
| Language - Children & Family | 2 | |
| Right Holders - Children & Family | 1 | |
| Activities of daily living | Disabilities | 35 |
| Disabilities (children) | 4 | |
| Disabilities (help, aids and assistive devices) | 3 | |
| Disabilities (funding/policy) | 2 | |
| Disabilities (education) | 2 | |
| Disabilities (accessibility) | 2 | |
| Disabilities (housing) | 1 | |
| Disabilities (labour) | 1 | |
| Disabilities (family) | 1 | |
| Other | 1 | |
| Immigration/Citizenship | Immigration/Citizenship | 5 |
| Labour | 3 | |
| Place of birth | 2 | |
| Non-permanent residents | 2 | |
| Place of birth of grandparents | 1 | |
| Integration | 1 | |
| Ethnocultural | Population group/visible minorities | 9 |
| Ethnic origin | 2 | |
| Indigenous | Other | 8 |
| Identity | 5 | |
| Coverage | 5 | |
| Métis | 3 | |
| Status | 3 | |
| Health | 3 | |
| Housing | 2 | |
| Indigenous education | 1 | |
| First Nation/band membership | 1 | |
| Religion | Every cycle request | 10 |
| Attendance/participation | 9 | |
| Religious groups | 3 | |
| Mobility | Mobility | 14 |
| Education | Educational attainment | 6 |
| Pathways | 5 | |
| Educational participation | 3 | |
| Parental education | 2 | |
| School attendance | 1 | |
| Home schooling | 1 | |
| Labour market outcomes | 1 | |
| Educational satisfaction | 1 | |
| Language of primary or secondary instruction | 1 | |
| Special needs education | 1 | |
| Taxes | 1 | |
| Other | 1 | |
| Youth schooling | 1 | |
| Location of study | 1 | |
| Labour | Unpaid work | 39 |
| Other | 36 | |
| Place of work | 29 | |
| Occupation | 12 | |
| Overemployment/Underemployment | 11 | |
| Veterans | 8 | |
| Job security | 6 | |
| Classification system | 5 | |
| Leave-related | 5 | |
| Benefits | 5 | |
| Unionization | 4 | |
| Temporary workers | 4 | |
| Labour market outcomes (education) | 4 | |
| Disabilities at work | 3 | |
| Hourly wages | 3 | |
| Self-employment | 3 | |
| Immigrants | 3 | |
| Job training | 2 | |
| Occupational health & safety | 2 | |
| Retirement | 1 | |
| Education | 1 | |
| Employment | 1 | |
| Economic | 1 | |
| Language at work | 1 | |
| Income | Wealth and debt | 14 |
| Poverty | 13 | |
| Spending | 11 | |
| Other | 7 | |
| Retirement | 3 | |
| Low income | 3 | |
| Economic mobility | 2 | |
| Indigenous | 1 | |
| Disability | 1 | |
| Income source | 1 | |
| Housing | Homelessness | 17 |
| Collectives | 17 | |
| Type & characteristics of dwelling | 15 | |
| Other | 7 | |
| Energy use | 6 | |
| Social housing | 4 | |
| Affordability | 4 | |
| Spending | 2 | |
| Renovations | 2 | |
| Mobility | 1 | |
| 92 year question | Other | 1 |
| Topics not part of the 2016 Census Program | ||
| Child care | Child care | 5 |
| Health | General Health | 49 |
| Mental health | 16 | |
| Lifestyle | 11 | |
| Well-being | 4 | |
| Environment | 1 | |
| Children | 1 | |
| Justice & public safety | Other | 14 |
| Population group/visible minorities | 3 | |
| Indigenous | 1 | |
| Immigration/Citizenship | 1 | |
| Technology | Other | 16 |
| Other | Other | 90 |
| Transportation | 40 | |
| Economic | 10 | |
| Environment | 9 | |
| Tourism | 5 | |
| Social services | 5 | |
| Other census | 3 | |
| Source: 2021 Census of Population online consultation. | ||
- Date modified: