
Update of the 2016 Census language data
After Statistics Canada was notified of anomalies, for various regions in Quebec, in the 2016 Census language data released on August 2, it conducted an in-depth investigation to identify their source.
During the census, Statistics Canada follows up with households that partially completed the census questionnaire. For the 2016 Census, Statistics Canada developed a computer program to perform certain steps of this operation. An error was identified in this computer program that affected French-language questionnaires.
The census language questions are the only questions for which response options differ between the French and English versions. Since 2001, the French version of the census questionnaire has given precedence to French in the wording of the questions and the response options. This only affects census questions on mother tongue, language spoken at home and knowledge of official languages. The example below illustrates this difference with respect to language spoken most often at home. This distinction was not taken into account by the new computer program used for partial non-response follow-up in 2016.
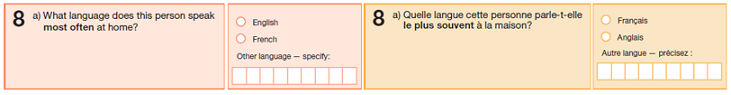
This bilingual figure shows Question 8 a) from the 2016 Census of Population questionnaire. The left portion of the figure displays the question in English which asks “What language does this person speak most often at home.” The answer categories are “English; French; Other language – specify.” The right portion of the figure displays the question in French which asks “Quelle langue cette personne parle t elle le plus souvent à la maison.” The answer categories are “Français; Anglais; Autre langue – précisez.”
The resulting error led to incorrect allocation of responses to the census language questions for roughly 61,000 individuals, mainly in Quebec. It resulted in an overestimation of the growth of English in Quebec between 2011 and 2016, both as a mother tongue and as a language spoken at home.
After correcting these allocation errors, Statistics Canada conducted an in-depth review to ensure that no other census questions were affected by an error and that the computer programs did not affect other variables. Moreover, Statistics Canada extensively reviewed the many data editing and control stages.
General consequences of the error on the language data results
The error resulted in an overestimation of the growth of English in Quebec and some of its regions, both for mother tongue and language spoken at home, and an overestimation of the decline of French. It also resulted in a slight overestimation of the rate of English–French bilingualism in Quebec and, as a result, across Canada.
Tables 1 and 2 show the proportions and numbers for each language variable in 2011 and 2016 (before and after adjustment) for Canada, Quebec and Canada outside Quebec.
In percentages (Table 1), it can be seen that the correction of the error does not affect Canada outside Quebec and that the findings reported on August 2 remain the same. It is mainly in Quebec that the correction results in changes to the findings.
In Quebec, both for mother tongue and language spoken most often at home, French declined less than initially reported. Thus, after adjustment, the population with French as a mother tongue (single responses) is 77.1% rather than 76.4% (roughly +55,000 individuals), and the population that speaks French most often at home (single responses) is 79.0% rather than 78.3% (roughly +57,000 individuals).
In terms of English as mother tongue, there is now a slight decrease instead of an increase. The proportion of the Quebec population with English as its only mother tongue is now 7.5% rather than 8.1% (roughly -55,000 individuals). With regard to English spoken most often at home, there is a slight decrease instead of an increase in terms of single responses (now 9.7% after adjustment instead of 10.4%, roughly -57,000 individuals) and a smaller increase when all of the responses are taken into account (now 12.0% instead of 12.7%, roughly -57,000 individuals).
These corrections slightly modify the national portrait for these two variables, with French declining slightly less than what was reported in the initial language data release.
Finally, these corrections slightly modify the level of English–French bilingualism previously reported, as well as the data on the first official language spoken. At the national level, the rate of bilingualism remains practically unchanged (18.0% to 17.9%), as well as for Canada outside Quebec (from 9.9% to 9.8%). In Quebec, the rate of English–French bilingualism is slightly lower than reported (44.5% rather than 44.9%).
The adjusted data on first official language spoken do not change the portrait in Canada outside Quebec. In Quebec, however, they show a smaller decline in French and a smaller increase in English. After equally redistributing the English–French category, English as the first official language spoken is now 13.7% instead of 14.4% (roughly -57,000 individuals), while French is now 85.4% instead of 84.7% (roughly +57,000 individuals).
| Language groups | Canada | Quebec | Canada outside Quebec | ||||||
|---|---|---|---|---|---|---|---|---|---|
| 2011 | 2016 before correction |
2016 after correction |
2011 | 2016 before correction |
2016 after correction |
2011 | 2016 before correction |
2016 after correction |
|
| percent | |||||||||
| Mother tongue (single responses) | |||||||||
| English | 56.9 | 56.1 | 56.0 | 7.7 | 8.1 | 7.5 | 72.2 | 70.6 | 70.6 |
| French | 21.3 | 20.4 | 20.6 | 78.1 | 76.4 | 77.1 | 3.8 | 3.5 | 3.5 |
| Other | 19.8 | 21.1 | 21.1 | 12.3 | 13.2 | 13.2 | 22.2 | 23.4 | 23.4 |
| Mother tongue (including multiple responses)Footnote 2 | |||||||||
| English | 58.6 | 58.2 | 58.1 | 9.0 | 9.6 | 8.9 | 74.0 | 72.9 | 72.9 |
| French | 22.0 | 21.3 | 21.4 | 79.7 | 78.4 | 79.1 | 4.2 | 4.0 | 4.0 |
| Other | 21.3 | 22.9 | 22.9 | 13.4 | 14.5 | 14.5 | 23.8 | 25.5 | 25.5 |
| Language spoken most often at home (single responses) | |||||||||
| English | 64.8 | 63.9 | 63.7 | 9.8 | 10.4 | 9.7 | 81.8 | 80.1 | 80.1 |
| French | 20.6 | 19.8 | 20.0 | 80.0 | 78.3 | 79.0 | 2.3 | 2.1 | 2.1 |
| Other | 11.1 | 11.5 | 11.5 | 7.1 | 7.3 | 7.3 | 12.3 | 12.8 | 12.8 |
| Language spoken most often at home (including multiple responses)Footnote 2 | |||||||||
| English | 68.0 | 68.3 | 68.1 | 11.7 | 12.7 | 12.0 | 85.3 | 85.1 | 85.1 |
| French | 21.5 | 20.9 | 21.1 | 82.5 | 81.7 | 82.4 | 2.6 | 2.5 | 2.5 |
| Other | 14.2 | 15.8 | 15.8 | 9.3 | 10.2 | 10.2 | 15.7 | 17.5 | 17.5 |
| Knowledge of official languages | |||||||||
| English | 68.1 | 68.3 | 68.3 | 4.7 | 4.6 | 4.6 | 87.7 | 87.6 | 87.6 |
| French | 12.6 | 11.8 | 11.9 | 51.8 | 49.6 | 50.0 | 0.5 | 0.4 | 0.4 |
| English and French | 17.5 | 18.0 | 17.9 | 42.6 | 44.9 | 44.5 | 9.7 | 9.9 | 9.8 |
| Neither English nor French | 1.8 | 1.9 | 1.9 | 1.0 | 0.9 | 0.9 | 2.1 | 2.1 | 2.1 |
| First official language spoken | |||||||||
| English | 74.5 | 75.0 | 74.8 | 12.0 | 12.7 | 12.0 | 93.8 | 93.8 | 93.8 |
| French | 22.7 | 22.0 | 22.2 | 84.0 | 83.0 | 83.7 | 3.7 | 3.6 | 3.6 |
| English and French | 1.1 | 1.2 | 1.2 | 3.1 | 3.5 | 3.5 | 0.5 | 0.5 | 0.5 |
| Neither English nor French | 1.8 | 1.8 | 1.8 | 0.9 | 0.9 | 0.9 | 2.0 | 2.1 | 2.1 |
|
Source: Statistics Canada, Census of Population, 2011 and 2016. |
|||||||||
| Language groups | Canada | Quebec | Canada outside Quebec | ||||||
|---|---|---|---|---|---|---|---|---|---|
| 2011 | 2016 before correction |
2016 after correction |
2011 | 2016 before correction |
2016 after correction |
2011 | 2016 before correction |
2016 after correction |
|
| number | |||||||||
| Mother tongue (single responses) | |||||||||
| English | 18,858,980 | 19,519,095 | 19,460,855 | 599,225 | 656,555 | 601,155 | 18,259,755 | 18,862,540 | 18,859,700 |
| French | 7,054,970 | 7,108,450 | 7,166,700 | 6,102,210 | 6,164,255 | 6,219,660 | 952,760 | 944,195 | 947,040 |
| Other | 6,567,680 | 7,321,070 | 7,321,060 | 961,695 | 1,060,845 | 1,060,830 | 5,605,985 | 6,260,225 | 6,260,230 |
| Mother tongue (including multiple responses)Footnote 2 | |||||||||
| English | 19,424,090 | 20,251,590 | 20,193,335 | 700,405 | 774,385 | 718,985 | 18,723,685 | 19,477,205 | 19,474,350 |
| French | 7,298,180 | 7,393,830 | 7,452,070 | 6,231,600 | 6,321,675 | 6,377,080 | 1,066,580 | 1,072,155 | 1,074,990 |
| Other | 7,062,535 | 7,974,375 | 7,974,370 | 1,049,715 | 1,173,345 | 1,173,340 | 6,012,820 | 6,801,030 | 6,801,030 |
| Language spoken most often at home (single responses) | |||||||||
| English | 21,457,080 | 22,222,660 | 22,162,870 | 767,415 | 839,425 | 782,185 | 20,689,665 | 21,383,235 | 21,380,685 |
| French | 6,827,860 | 6,884,010 | 6,943,800 | 6,249,080 | 6,318,430 | 6,375,670 | 578,780 | 565,580 | 568,130 |
| Other | 3,673,865 | 3,997,205 | 3,997,200 | 554,400 | 585,895 | 585,890 | 3,119,465 | 3,411,310 | 3,411,310 |
| Language spoken most often at home (including multiple responses)Footnote 2 | |||||||||
| English | 22,509,750 | 23,737,130 | 23,677,345 | 912,360 | 1,022,865 | 965,615 | 21,597,390 | 22,714,265 | 22,711,730 |
| French | 7,115,095 | 7,262,410 | 7,322,210 | 6,450,370 | 6,586,845 | 6,644,095 | 664,725 | 675,565 | 678,115 |
| Other | 4,705,030 | 5,500,405 | 5,500,405 | 727,900 | 821,995 | 821,995 | 3,977,130 | 4,678,410 | 4,678,410 |
| Knowledge of official languages | |||||||||
| English | 22,564,670 | 23,758,065 | 23,757,525 | 363,860 | 373,210 | 372,450 | 22,200,810 | 23,384,855 | 23,385,075 |
| French | 4,165,015 | 4,108,730 | 4,144,685 | 4,047,175 | 3,997,575 | 4,032,640 | 117,840 | 111,155 | 112,045 |
| English and French | 5,795,575 | 6,251,490 | 6,216,070 | 3,328,725 | 3,620,715 | 3,586,410 | 2,466,850 | 2,630,775 | 2,629,660 |
| Neither English nor French | 595,920 | 648,970 | 648,970 | 76,195 | 75,060 | 75,060 | 519,725 | 573,910 | 573,910 |
| First official language spoken | |||||||||
| English | 24,662,895 | 26,067,415 | 26,007,495 | 935,635 | 1,021,165 | 964,120 | 23,727,260 | 25,046,250 | 25,043,375 |
| French | 7,507,885 | 7,645,825 | 7,705,755 | 6,561,510 | 6,693,905 | 6,750,950 | 946,375 | 951,920 | 954,805 |
| English and French | 367,635 | 417,495 | 417,485 | 245,230 | 278,720 | 278,710 | 122,405 | 138,775 | 138,775 |
| Neither English nor French | 582,755 | 636,515 | 636,515 | 73,575 | 72,775 | 72,780 | 509,180 | 563,740 | 563,735 |
|
Source: Statistics Canada, Census of Population, 2011 and 2016 |
|||||||||
- Date modified: