
Archived Content
Information identified as archived is provided for reference, research or recordkeeping purposes. It is not subject to the Government of Canada Web Standards and has not been altered or updated since it was archived. Please contact us to request a format other than those available.
Census Profile
Data table
Data table
| Characteristic |
Saint-Léonard - Saint-Michel
Quebec (Federal electoral district, 2003 representation order) |
Saskatchewan

(Province) |
||||
|---|---|---|---|---|---|---|
| Total | Male | Female | Total | Male | Female | |
| Population and dwelling counts | ||||||
| Population in 2011Census data footnote 1 | 108,811 | ...Data not available | ...Data not available | 1,033,381† | ...Data not available | ...Data not available |
| Population in 2006Census data footnote 1 | 104,786 | ...Data not available | ...Data not available | 968,157† | ...Data not available | ...Data not available |
| 2006 to 2011 population change (%) | 3.8 | ...Data not available | ...Data not available | 6.7 | ...Data not available | ...Data not available |
| Total private dwellingsCensus data footnote 2 | 45,350 | ...Data not available | ...Data not available | 460,512 | ...Data not available | ...Data not available |
| Private dwellings occupied by usual residentsCensus data footnote 3 | 43,210 | ...Data not available | ...Data not available | 409,645 | ...Data not available | ...Data not available |
| Population density per square kilometre | 5,436.5 | ...Data not available | ...Data not available | 1.8 | ...Data not available | ...Data not available |
| Land area (square km) | 20.02 | ...Data not available | ...Data not available | 588,239.21 | ...Data not available | ...Data not available |
| Age characteristics | ||||||
| Total population by age groupsCensus data footnote 4 | 108,815 | 51,870 | 56,940 | 1,033,380 | 511,555 | 521,825 |
| 0 to 4 years | 8,490 | 4,285 | 4,205 | 68,760 | 35,070 | 33,690 |
| 5 to 9 years | 6,520 | 3,265 | 3,260 | 63,350 | 32,480 | 30,865 |
| 10 to 14 years | 6,040 | 3,055 | 2,980 | 65,750 | 33,465 | 32,285 |
| 15 to 19 years | 6,095 | 3,035 | 3,055 | 71,760 | 36,870 | 34,885 |
| 15 years | 1,240 | 635 | 610 | 13,910 | 7,140 | 6,765 |
| 16 years | 1,270 | 635 | 635 | 14,465 | 7,390 | 7,075 |
| 17 years | 1,210 | 615 | 600 | 14,405 | 7,425 | 6,985 |
| 18 years | 1,200 | 560 | 640 | 14,540 | 7,505 | 7,040 |
| 19 years | 1,180 | 595 | 575 | 14,430 | 7,420 | 7,015 |
| 20 to 24 years | 6,115 | 2,945 | 3,170 | 72,610 | 37,135 | 35,470 |
| 25 to 29 years | 6,790 | 2,975 | 3,820 | 70,395 | 35,510 | 34,885 |
| 30 to 34 years | 7,605 | 3,470 | 4,140 | 65,340 | 32,750 | 32,590 |
| 35 to 39 years | 8,135 | 4,080 | 4,055 | 61,150 | 30,265 | 30,880 |
| 40 to 44 years | 8,460 | 4,455 | 4,005 | 61,475 | 30,550 | 30,920 |
| 45 to 49 years | 7,580 | 3,870 | 3,710 | 74,630 | 36,820 | 37,810 |
| 50 to 54 years | 6,870 | 3,350 | 3,525 | 77,480 | 38,855 | 38,625 |
| 55 to 59 years | 5,950 | 2,755 | 3,195 | 70,050 | 35,185 | 34,865 |
| 60 to 64 years | 5,705 | 2,515 | 3,185 | 56,945 | 28,305 | 28,645 |
| 65 to 69 years | 4,640 | 2,020 | 2,615 | 41,500 | 20,445 | 21,055 |
| 70 to 74 years | 4,645 | 1,990 | 2,660 | 33,820 | 16,050 | 17,770 |
| 75 to 79 years | 4,065 | 1,785 | 2,275 | 28,950 | 13,200 | 15,750 |
| 80 to 84 years | 2,910 | 1,195 | 1,715 | 23,955 | 10,165 | 13,795 |
| 85 years and over | 2,185 | 815 | 1,375 | 25,475 | 8,435 | 17,035 |
| Median age of the populationCensus data footnote 5 | 39.2 | 38.6 | 39.7 | 38.2 | 37.0 | 39.2 |
| % of the population aged 15 and over | 80.7 | 79.5 | 81.7 | 80.9 | 80.3 | 81.4 |
| Marital status | ||||||
| Total population 15 years and over by marital statusCensus data footnote 6 | 87,760 | 41,265 | 46,490 | 835,525 | 410,545 | 424,980 |
| Married or living with a common-law partner | 46,945 | 23,535 | 23,405 | 487,980 | 244,485 | 243,495 |
| Married (and not separated) | 40,195 | 20,165 | 20,030 | 416,355 | 208,700 | 207,655 |
| Living common law | 6,750 | 3,375 | 3,375 | 71,630 | 35,785 | 35,845 |
| Not married and not living with a common-law partner | 40,815 | 17,725 | 23,090 | 347,535 | 166,055 | 181,480 |
| Single (never legally married) | 25,510 | 13,250 | 12,255 | 232,160 | 128,325 | 103,835 |
| Separated | 2,095 | 800 | 1,300 | 18,210 | 8,220 | 9,990 |
| Divorced | 7,150 | 2,625 | 4,525 | 43,665 | 19,500 | 24,170 |
| Widowed | 6,060 | 1,050 | 5,010 | 53,500 | 10,015 | 43,490 |
| Family characteristics | ||||||
| Total number of census families in private householdsCensus data footnote 7 | 29,770 | ...Data not available | ...Data not available | 285,370 | ...Data not available | ...Data not available |
| Size of census family: 2 persons | 13,340 | ...Data not available | ...Data not available | 148,805 | ...Data not available | ...Data not available |
| Size of census family: 3 persons | 7,210 | ...Data not available | ...Data not available | 55,360 | ...Data not available | ...Data not available |
| Size of census family: 4 persons | 6,240 | ...Data not available | ...Data not available | 51,115 | ...Data not available | ...Data not available |
| Size of census family: 5 or more persons | 2,980 | ...Data not available | ...Data not available | 30,095 | ...Data not available | ...Data not available |
| Total number of census families in private householdsCensus data footnote 8 | 29,775 | ...Data not available | ...Data not available | 285,375 | ...Data not available | ...Data not available |
| Total couple families by family structure and number of children | 22,755 | ...Data not available | ...Data not available | 238,550 | ...Data not available | ...Data not available |
| Married couples | 19,385 | ...Data not available | ...Data not available | 202,765 | ...Data not available | ...Data not available |
| Without children at home | 7,280 | ...Data not available | ...Data not available | 102,740 | ...Data not available | ...Data not available |
| With children at home | 12,105 | ...Data not available | ...Data not available | 100,030 | ...Data not available | ...Data not available |
| 1 child | 4,450 | ...Data not available | ...Data not available | 35,570 | ...Data not available | ...Data not available |
| 2 children | 5,100 | ...Data not available | ...Data not available | 41,100 | ...Data not available | ...Data not available |
| 3 or more children | 2,550 | ...Data not available | ...Data not available | 23,360 | ...Data not available | ...Data not available |
| Common-law couples | 3,375 | ...Data not available | ...Data not available | 35,780 | ...Data not available | ...Data not available |
| Without children at home | 1,825 | ...Data not available | ...Data not available | 19,585 | ...Data not available | ...Data not available |
| With children at home | 1,545 | ...Data not available | ...Data not available | 16,200 | ...Data not available | ...Data not available |
| 1 child | 775 | ...Data not available | ...Data not available | 7,070 | ...Data not available | ...Data not available |
| 2 children | 555 | ...Data not available | ...Data not available | 5,180 | ...Data not available | ...Data not available |
| 3 or more children | 220 | ...Data not available | ...Data not available | 3,945 | ...Data not available | ...Data not available |
| Total lone-parent families by sex of parent and number of children | 7,020 | ...Data not available | ...Data not available | 46,825 | ...Data not available | ...Data not available |
| Female parent | 5,905 | ...Data not available | ...Data not available | 36,215 | ...Data not available | ...Data not available |
| 1 child | 3,485 | ...Data not available | ...Data not available | 19,685 | ...Data not available | ...Data not available |
| 2 children | 1,705 | ...Data not available | ...Data not available | 10,105 | ...Data not available | ...Data not available |
| 3 or more children | 720 | ...Data not available | ...Data not available | 6,430 | ...Data not available | ...Data not available |
| Male parent | 1,110 | ...Data not available | ...Data not available | 10,605 | ...Data not available | ...Data not available |
| 1 child | 755 | ...Data not available | ...Data not available | 6,795 | ...Data not available | ...Data not available |
| 2 children | 280 | ...Data not available | ...Data not available | 2,615 | ...Data not available | ...Data not available |
| 3 or more children | 75 | ...Data not available | ...Data not available | 1,195 | ...Data not available | ...Data not available |
| Total children in census families in private households | 36,595 | ...Data not available | ...Data not available | 308,835 | ...Data not available | ...Data not available |
| Under six years of age | 9,905 | ...Data not available | ...Data not available | 79,470 | ...Data not available | ...Data not available |
| 6 to 14 years | 11,030 | ...Data not available | ...Data not available | 112,695 | ...Data not available | ...Data not available |
| 15 to 17 years | 3,620 | ...Data not available | ...Data not available | 39,820 | ...Data not available | ...Data not available |
| 18 to 24 years | 6,345 | ...Data not available | ...Data not available | 54,525 | ...Data not available | ...Data not available |
| 25 years and over | 5,690 | ...Data not available | ...Data not available | 22,335 | ...Data not available | ...Data not available |
| Average number of children at home per census family | 1.2 | ...Data not available | ...Data not available | 1.1 | ...Data not available | ...Data not available |
| Household and dwelling characteristics | ||||||
| Total number of persons in private households | 107,675 | 51,410 | 56,265 | 1,009,040 | 500,680 | 508,360 |
| Number of persons not in census families | 18,550 | 8,370 | 10,180 | 176,280 | 87,630 | 88,650 |
| Living with relativesCensus data footnote 9 | 3,105 | 1,315 | 1,790 | 23,550 | 12,035 | 11,510 |
| Living with non-relatives only | 2,985 | 1,835 | 1,150 | 38,345 | 22,810 | 15,535 |
| Living alone | 12,460 | 5,220 | 7,240 | 114,385 | 52,780 | 61,605 |
| Number of census family persons | 89,125 | 43,035 | 46,085 | 832,755 | 413,050 | 419,710 |
| Average number of persons per census family | 3.0 | ...Data not available | ...Data not available | 2.9 | ...Data not available | ...Data not available |
| Total number of persons aged 65 years and over in private households | 17,615 | 7,565 | 10,045 | 141,370 | 64,460 | 76,910 |
| Number of persons not in census families aged 65 years and over | 5,945 | 1,495 | 4,450 | 50,190 | 14,780 | 35,415 |
| Living with relativesCensus data footnote 9 | 1,005 | 230 | 775 | 3,395 | 1,115 | 2,285 |
| Living with non-relatives only | 310 | 155 | 155 | 1,930 | 970 | 960 |
| Living alone | 4,625 | 1,110 | 3,520 | 44,870 | 12,700 | 32,170 |
| Number of census family persons aged 65 years and over | 11,670 | 6,070 | 5,600 | 91,180 | 49,685 | 41,495 |
| Total number of private households by household typeCensus data footnote 10 | 43,210 | ...Data not available | ...Data not available | 409,645 | ...Data not available | ...Data not available |
| Census-family households | 29,080 | ...Data not available | ...Data not available | 277,880 | ...Data not available | ...Data not available |
| One-family-only householdsCensus data footnote 11 | 26,380 | ...Data not available | ...Data not available | 255,670 | ...Data not available | ...Data not available |
| Couple-family householdsCensus data footnote 12 | 20,685 | ...Data not available | ...Data not available | 221,710 | ...Data not available | ...Data not available |
| Without children | 8,245 | ...Data not available | ...Data not available | 114,595 | ...Data not available | ...Data not available |
| With children | 12,445 | ...Data not available | ...Data not available | 107,120 | ...Data not available | ...Data not available |
| Lone-parent-family households | 5,695 | ...Data not available | ...Data not available | 33,960 | ...Data not available | ...Data not available |
| Other family householdsCensus data footnote 13 | 2,700 | ...Data not available | ...Data not available | 22,205 | ...Data not available | ...Data not available |
| One-family households with persons not in a census family | 2,025 | ...Data not available | ...Data not available | 15,220 | ...Data not available | ...Data not available |
| Couple-family householdsCensus data footnote 14 | 1,240 | ...Data not available | ...Data not available | 9,145 | ...Data not available | ...Data not available |
| Without children | 430 | ...Data not available | ...Data not available | 3,970 | ...Data not available | ...Data not available |
| With children | 815 | ...Data not available | ...Data not available | 5,175 | ...Data not available | ...Data not available |
| Lone-parent-family households | 785 | ...Data not available | ...Data not available | 6,075 | ...Data not available | ...Data not available |
| Two-or-more-family households | 675 | ...Data not available | ...Data not available | 6,990 | ...Data not available | ...Data not available |
| Non-census-family households | 14,125 | ...Data not available | ...Data not available | 131,765 | ...Data not available | ...Data not available |
| One-person households | 12,460 | ...Data not available | ...Data not available | 114,385 | ...Data not available | ...Data not available |
| Two-or-more-person households | 1,665 | ...Data not available | ...Data not available | 17,380 | ...Data not available | ...Data not available |
| Total number of occupied private dwellings by structural type of dwellingCensus data footnote 15 | 43,210 | ...Data not available | ...Data not available | 409,645 | ...Data not available | ...Data not available |
| Single-detached house | 2,650 | ...Data not available | ...Data not available | 303,250 | ...Data not available | ...Data not available |
| Apartment, building that has five or more storeys | 1,970 | ...Data not available | ...Data not available | 10,830 | ...Data not available | ...Data not available |
| Movable dwellingCensus data footnote 16 | 5 | ...Data not available | ...Data not available | 8,805 | ...Data not available | ...Data not available |
| Other dwellingCensus data footnote 17 | 38,585 | ...Data not available | ...Data not available | 86,755 | ...Data not available | ...Data not available |
| Semi-detached house | 955 | ...Data not available | ...Data not available | 11,945 | ...Data not available | ...Data not available |
| Row house | 175 | ...Data not available | ...Data not available | 14,370 | ...Data not available | ...Data not available |
| Apartment, duplex | 6,425 | ...Data not available | ...Data not available | 7,090 | ...Data not available | ...Data not available |
| Apartment, building that has fewer than five storeys | 30,865 | ...Data not available | ...Data not available | 52,655 | ...Data not available | ...Data not available |
| Other single-attached house | 170 | ...Data not available | ...Data not available | 700 | ...Data not available | ...Data not available |
| Total number of private households by household sizeCensus data footnote 18 | 43,210 | ...Data not available | ...Data not available | 409,645 | ...Data not available | ...Data not available |
| 1 person | 12,460 | ...Data not available | ...Data not available | 114,385 | ...Data not available | ...Data not available |
| 2 persons | 13,035 | ...Data not available | ...Data not available | 146,850 | ...Data not available | ...Data not available |
| 3 persons | 7,380 | ...Data not available | ...Data not available | 57,410 | ...Data not available | ...Data not available |
| 4 persons | 6,440 | ...Data not available | ...Data not available | 53,070 | ...Data not available | ...Data not available |
| 5 persons | 2,670 | ...Data not available | ...Data not available | 23,455 | ...Data not available | ...Data not available |
| 6 or more persons | 1,220 | ...Data not available | ...Data not available | 14,470 | ...Data not available | ...Data not available |
| Number of persons in private households | 107,675 | ...Data not available | ...Data not available | 1,009,040 | ...Data not available | ...Data not available |
| Average number of persons in private households | 2.5 | ...Data not available | ...Data not available | 2.5 | ...Data not available | ...Data not available |
| Detailed mother tongue | ||||||
| Detailed mother tongue - Total population excluding institutional residentsCensus data footnote 19 | 108,590 | 51,790 | 56,800 | 1,018,310 | 505,085 | 513,230 |
| Single responses | 102,535 | 48,800 | 53,735 | 1,005,810 | 499,115 | 506,695 |
| English | 6,975 | 3,545 | 3,430 | 860,500 | 428,115 | 432,385 |
| French | 33,650 | 15,655 | 17,995 | 16,280 | 7,760 | 8,525 |
| Non-official languages | 61,915 | 29,605 | 32,310 | 129,035 | 63,245 | 65,785 |
| Selected Aboriginal languagesCensus data footnote 20 | 15 | 0 | 10 | 30,895 | 15,105 | 15,790 |
| Atikamekw | 10 | 0 | 10 | 0 | 0 | 0 |
| Cree, n.o.s. | 0 | 0 | 5 | 21,950 | 10,765 | 11,190 |
| Dene | 0 | 0 | 0 | 7,955 | 3,900 | 4,055 |
| Innu/Montagnais | 5 | 0 | 0 | 0 | 0 | 0 |
| Inuktitut | 0 | 0 | 0 | 20 | 0 | 15 |
| Mi'kmaq | 0 | 0 | 0 | 5 | 5 | 5 |
| Ojibway | 0 | 0 | 0 | 950 | 430 | 520 |
| Oji-Cree | 0 | 0 | 0 | 5 | 5 | 0 |
| Stoney | 0 | 0 | 0 | 5 | 5 | 5 |
| Selected non-Aboriginal languagesCensus data footnote 21 | 61,500 | 29,410 | 32,095 | 96,540 | 47,370 | 49,165 |
| African languages, n.i.e. | 25 | 20 | 5 | 420 | 235 | 185 |
| Afrikaans | 0 | 0 | 0 | 740 | 375 | 360 |
| Akan (Twi) | 25 | 10 | 15 | 105 | 60 | 45 |
| Albanian | 65 | 30 | 40 | 175 | 90 | 90 |
| Amharic | 5 | 5 | 5 | 215 | 110 | 110 |
| Arabic | 10,485 | 5,420 | 5,065 | 2,045 | 1,150 | 900 |
| Armenian | 45 | 25 | 20 | 10 | 5 | 5 |
| Bantu languages, n.i.e. | 75 | 40 | 35 | 180 | 100 | 80 |
| Bengali | 415 | 210 | 205 | 1,310 | 725 | 580 |
| Berber languages (Kabyle) | 740 | 375 | 365 | 0 | 5 | 0 |
| Bisayan languages | 5 | 0 | 0 | 620 | 245 | 375 |
| Bosnian | 20 | 10 | 10 | 235 | 115 | 125 |
| Bulgarian | 185 | 90 | 95 | 45 | 25 | 25 |
| Burmese | 0 | 0 | 0 | 160 | 100 | 60 |
| Cantonese | 410 | 190 | 210 | 1,725 | 835 | 890 |
| Chinese, n.o.s. | 1,480 | 680 | 800 | 5,375 | 2,685 | 2,690 |
| Creoles | 5,745 | 2,555 | 3,190 | 80 | 50 | 35 |
| Croatian | 50 | 25 | 25 | 315 | 155 | 165 |
| Czech | 5 | 5 | 5 | 270 | 130 | 145 |
| Danish | 0 | 0 | 0 | 310 | 175 | 135 |
| Dutch | 15 | 5 | 10 | 1,550 | 750 | 805 |
| Estonian | 0 | 0 | 0 | 15 | 5 | 15 |
| Finnish | 0 | 0 | 5 | 205 | 85 | 120 |
| Flemish | 5 | 0 | 5 | 75 | 30 | 45 |
| Fukien | 0 | 0 | 0 | 15 | 10 | 5 |
| German | 75 | 35 | 40 | 25,415 | 12,200 | 13,215 |
| Greek | 385 | 175 | 205 | 835 | 435 | 395 |
| Gujarati | 120 | 55 | 65 | 700 | 430 | 265 |
| Hakka | 5 | 0 | 0 | 5 | 5 | 0 |
| Hebrew | 0 | 0 | 0 | 50 | 25 | 25 |
| Hindi | 30 | 15 | 15 | 840 | 505 | 330 |
| Hungarian | 60 | 30 | 25 | 1,665 | 845 | 815 |
| Ilocano | 5 | 0 | 5 | 345 | 150 | 200 |
| Indo-Iranian languages, n.i.e. | 15 | 10 | 5 | 155 | 90 | 70 |
| Italian | 20,425 | 9,580 | 10,850 | 730 | 385 | 345 |
| Japanese | 10 | 5 | 5 | 275 | 95 | 185 |
| Khmer (Cambodian) | 1,200 | 570 | 630 | 120 | 60 | 65 |
| Korean | 10 | 5 | 5 | 1,230 | 595 | 630 |
| Kurdish | 120 | 55 | 60 | 100 | 60 | 40 |
| Lao | 255 | 140 | 115 | 325 | 170 | 160 |
| Latvian | 0 | 0 | 0 | 60 | 30 | 30 |
| Lingala | 190 | 85 | 100 | 15 | 10 | 5 |
| Lithuanian | 10 | 5 | 5 | 20 | 10 | 10 |
| Macedonian | 0 | 5 | 0 | 25 | 15 | 15 |
| Malay | 5 | 5 | 0 | 80 | 25 | 50 |
| Malayalam | 10 | 0 | 10 | 200 | 105 | 95 |
| Maltese | 0 | 0 | 0 | 5 | 5 | 5 |
| Mandarin | 130 | 60 | 70 | 1,425 | 710 | 715 |
| Marathi | 0 | 0 | 0 | 70 | 35 | 35 |
| Nepali | 15 | 5 | 15 | 325 | 170 | 160 |
| Niger-Congo languages, n.i.e. | 120 | 60 | 55 | 295 | 150 | 145 |
| Norwegian | 0 | 5 | 0 | 540 | 240 | 300 |
| Oromo | 855 | 455 | 395 | 160 | 95 | 70 |
| Panjabi (Punjabi) | 35 | 15 | 15 | 2,105 | 1,225 | 885 |
| Pashto | 25 | 10 | 10 | 275 | 155 | 120 |
| Persian (Farsi) | 220 | 115 | 110 | 1,010 | 550 | 465 |
| Polish | 425 | 160 | 265 | 1,910 | 885 | 1,025 |
| Portuguese | 1,475 | 675 | 795 | 475 | 215 | 260 |
| Romanian | 675 | 315 | 360 | 855 | 415 | 440 |
| Rundi (Kirundi) | 15 | 10 | 5 | 55 | 30 | 25 |
| Russian | 265 | 100 | 165 | 2,355 | 1,125 | 1,225 |
| Rwanda (Kinyarwanda) | 55 | 30 | 30 | 35 | 25 | 15 |
| Semitic languages, n.i.e. | 5 | 0 | 5 | 480 | 245 | 235 |
| Serbian | 40 | 15 | 25 | 435 | 215 | 220 |
| Serbo-Croatian | 15 | 5 | 10 | 135 | 70 | 65 |
| Shanghainese | 5 | 0 | 5 | 15 | 10 | 5 |
| Sign languages, n.i.e. | 10 | 5 | 0 | 120 | 70 | 45 |
| Sindhi | 10 | 0 | 5 | 60 | 35 | 30 |
| Sinhala (Sinhalese) | 15 | 10 | 5 | 175 | 90 | 85 |
| Sino-Tibetan languages, n.i.e. | 0 | 5 | 0 | 595 | 300 | 300 |
| Slavic languages, n.i.e. | 5 | 5 | 5 | 330 | 170 | 165 |
| Slovak | 15 | 5 | 10 | 140 | 80 | 60 |
| Slovenian | 80 | 30 | 50 | 80 | 45 | 35 |
| Somali | 15 | 5 | 10 | 435 | 205 | 230 |
| Spanish | 9,450 | 4,510 | 4,940 | 3,230 | 1,645 | 1,585 |
| Swahili | 30 | 20 | 15 | 230 | 125 | 105 |
| Swedish | 5 | 0 | 0 | 245 | 100 | 145 |
| Tagalog (Pilipino, Filipino) | 60 | 15 | 45 | 9,260 | 4,365 | 4,900 |
| Taiwanese | 0 | 0 | 0 | 45 | 15 | 25 |
| Tamil | 685 | 330 | 350 | 275 | 170 | 110 |
| Telugu | 0 | 5 | 0 | 160 | 95 | 65 |
| Thai | 35 | 15 | 20 | 120 | 50 | 70 |
| Tibetan languages | 0 | 0 | 0 | 10 | 10 | 5 |
| Tigrigna | 0 | 0 | 0 | 350 | 165 | 185 |
| Turkish | 925 | 460 | 465 | 180 | 95 | 85 |
| Ukrainian | 325 | 140 | 190 | 13,150 | 5,915 | 7,230 |
| Urdu | 105 | 65 | 50 | 3,215 | 1,715 | 1,500 |
| Vietnamese | 2,630 | 1,295 | 1,330 | 1,745 | 860 | 890 |
| Yiddish | 0 | 0 | 0 | 15 | 10 | 5 |
| Other languagesCensus data footnote 22 | 395 | 190 | 205 | 1,600 | 770 | 830 |
| Multiple responses | 6,055 | 2,995 | 3,065 | 12,500 | 5,970 | 6,530 |
| English and French | 665 | 315 | 350 | 1,730 | 805 | 920 |
| English and non-official language | 870 | 435 | 430 | 9,850 | 4,720 | 5,125 |
| French and non-official language | 3,935 | 1,940 | 1,990 | 750 | 360 | 390 |
| English, French and non-official language | 590 | 300 | 290 | 175 | 75 | 95 |
| Knowledge of official languages | ||||||
| Knowledge of official languages - Total population excluding institutional residentsCensus data footnote 19 | 108,595 | 51,795 | 56,800 | 1,018,315 | 505,085 | 513,230 |
| English only | 5,435 | 2,780 | 2,655 | 965,920 | 481,535 | 484,390 |
| French only | 46,305 | 20,225 | 26,075 | 430 | 195 | 235 |
| English and French | 51,205 | 26,735 | 24,470 | 46,570 | 20,855 | 25,715 |
| Neither English nor French | 5,645 | 2,055 | 3,595 | 5,395 | 2,505 | 2,885 |
| First official language spoken | ||||||
| First official language spoken - Total population excluding institutional residentsCensus data footnote 19 | 108,590 | 51,790 | 56,800 | 1,018,310 | 505,085 | 513,225 |
| English | 21,420 | 10,710 | 10,705 | 998,300 | 495,535 | 502,765 |
| French | 68,745 | 32,005 | 36,740 | 13,710 | 6,595 | 7,115 |
| English and French | 12,970 | 7,100 | 5,870 | 1,160 | 595 | 570 |
| Neither English nor French | 5,460 | 1,975 | 3,485 | 5,145 | 2,360 | 2,780 |
| Official language minority (number)Census data footnote 23 | 27,900 | 14,265 | 13,635 | 14,290 | 6,890 | 7,400 |
| Official language minority (percentage)Census data footnote 23 | 25.7 | 27.5 | 24.0 | 1.4 | 1.4 | 1.4 |
| Detailed language spoken most often at home | ||||||
| Detailed language spoken most often at home - Total population excluding institutional residentsCensus data footnote 19 | 108,590 | 51,790 | 56,800 | 1,018,310 | 505,085 | 513,225 |
| Single responses | 95,210 | 45,250 | 49,965 | 1,001,705 | 497,005 | 504,700 |
| English | 16,940 | 8,380 | 8,560 | 938,170 | 465,005 | 473,170 |
| French | 41,475 | 19,630 | 21,845 | 4,295 | 1,990 | 2,305 |
| Non-official languages | 36,795 | 17,240 | 19,555 | 59,240 | 30,005 | 29,230 |
| Selected Aboriginal languagesCensus data footnote 20 | 10 | 0 | 5 | 17,360 | 8,785 | 8,565 |
| Atikamekw | 5 | 0 | 5 | 0 | 0 | 0 |
| Cree, n.o.s. | 5 | 0 | 0 | 10,970 | 5,605 | 5,365 |
| Dene | 0 | 0 | 0 | 6,205 | 3,105 | 3,095 |
| Innu/Montagnais | 0 | 0 | 0 | 0 | 0 | 0 |
| Inuktitut | 0 | 0 | 0 | 10 | 5 | 5 |
| Mi'kmaq | 0 | 0 | 0 | 5 | 5 | 0 |
| Ojibway | 0 | 0 | 0 | 175 | 70 | 100 |
| Oji-Cree | 0 | 0 | 0 | 0 | 0 | 0 |
| Stoney | 0 | 0 | 0 | 0 | 0 | 0 |
| Selected non-Aboriginal languagesCensus data footnote 21 | 36,625 | 17,160 | 19,465 | 41,330 | 20,945 | 20,390 |
| African languages, n.i.e. | 20 | 15 | 5 | 180 | 100 | 80 |
| Afrikaans | 0 | 0 | 0 | 470 | 240 | 235 |
| Akan (Twi) | 15 | 5 | 10 | 30 | 15 | 15 |
| Albanian | 45 | 15 | 25 | 130 | 60 | 65 |
| Amharic | 0 | 0 | 0 | 110 | 50 | 60 |
| Arabic | 5,880 | 2,975 | 2,905 | 1,380 | 735 | 640 |
| Armenian | 15 | 10 | 5 | 5 | 5 | 0 |
| Bantu languages, n.i.e. | 10 | 5 | 10 | 35 | 20 | 15 |
| Bengali | 345 | 160 | 180 | 1,000 | 535 | 465 |
| Berber languages (Kabyle) | 240 | 115 | 130 | 0 | 0 | 0 |
| Bisayan languages | 0 | 0 | 0 | 275 | 125 | 145 |
| Bosnian | 15 | 5 | 10 | 120 | 60 | 55 |
| Bulgarian | 165 | 80 | 80 | 15 | 10 | 10 |
| Burmese | 0 | 0 | 0 | 125 | 70 | 55 |
| Cantonese | 340 | 155 | 185 | 1,065 | 505 | 560 |
| Chinese, n.o.s. | 1,205 | 555 | 645 | 3,690 | 1,830 | 1,860 |
| Creoles | 2,770 | 1,270 | 1,495 | 30 | 20 | 10 |
| Croatian | 25 | 10 | 10 | 80 | 35 | 40 |
| Czech | 0 | 0 | 0 | 30 | 15 | 15 |
| Danish | 0 | 0 | 0 | 20 | 10 | 5 |
| Dutch | 0 | 0 | 0 | 150 | 80 | 70 |
| Estonian | 0 | 0 | 0 | 5 | 0 | 5 |
| Finnish | 0 | 0 | 0 | 25 | 15 | 10 |
| Flemish | 0 | 0 | 0 | 0 | 0 | 0 |
| Fukien | 0 | 0 | 0 | 10 | 10 | 5 |
| German | 15 | 5 | 5 | 7,925 | 3,880 | 4,040 |
| Greek | 200 | 80 | 115 | 290 | 140 | 155 |
| Gujarati | 75 | 40 | 40 | 385 | 230 | 155 |
| Hakka | 0 | 0 | 0 | 0 | 0 | 0 |
| Hebrew | 0 | 0 | 0 | 30 | 15 | 15 |
| Hindi | 25 | 15 | 20 | 470 | 265 | 205 |
| Hungarian | 20 | 10 | 10 | 205 | 105 | 105 |
| Ilocano | 0 | 0 | 0 | 110 | 55 | 60 |
| Indo-Iranian languages, n.i.e. | 0 | 5 | 0 | 85 | 50 | 40 |
| Italian | 10,140 | 4,450 | 5,685 | 145 | 70 | 75 |
| Japanese | 0 | 5 | 0 | 110 | 40 | 70 |
| Khmer (Cambodian) | 900 | 410 | 490 | 50 | 20 | 25 |
| Korean | 10 | 5 | 5 | 955 | 475 | 480 |
| Kurdish | 40 | 20 | 20 | 40 | 25 | 15 |
| Lao | 170 | 95 | 70 | 155 | 85 | 70 |
| Latvian | 0 | 0 | 0 | 35 | 20 | 15 |
| Lingala | 60 | 30 | 35 | 15 | 10 | 5 |
| Lithuanian | 0 | 0 | 5 | 0 | 5 | 0 |
| Macedonian | 0 | 0 | 0 | 15 | 5 | 10 |
| Malay | 0 | 5 | 0 | 15 | 5 | 10 |
| Malayalam | 0 | 0 | 0 | 105 | 50 | 55 |
| Maltese | 0 | 0 | 0 | 0 | 0 | 0 |
| Mandarin | 125 | 60 | 65 | 1,100 | 575 | 525 |
| Marathi | 0 | 0 | 0 | 30 | 15 | 15 |
| Nepali | 15 | 5 | 10 | 250 | 130 | 120 |
| Niger-Congo languages, n.i.e. | 30 | 15 | 15 | 60 | 30 | 35 |
| Norwegian | 0 | 0 | 0 | 10 | 5 | 10 |
| Oromo | 270 | 150 | 120 | 100 | 55 | 45 |
| Panjabi (Punjabi) | 25 | 10 | 10 | 1,305 | 745 | 560 |
| Pashto | 15 | 10 | 10 | 150 | 80 | 65 |
| Persian (Farsi) | 165 | 80 | 90 | 655 | 340 | 315 |
| Polish | 240 | 105 | 140 | 325 | 155 | 175 |
| Portuguese | 825 | 385 | 435 | 150 | 70 | 80 |
| Romanian | 550 | 260 | 290 | 310 | 145 | 165 |
| Rundi (Kirundi) | 5 | 0 | 5 | 25 | 15 | 10 |
| Russian | 195 | 80 | 115 | 1,290 | 660 | 630 |
| Rwanda (Kinyarwanda) | 15 | 5 | 10 | 10 | 5 | 5 |
| Semitic languages, n.i.e. | 5 | 0 | 0 | 375 | 190 | 190 |
| Serbian | 20 | 10 | 10 | 300 | 145 | 155 |
| Serbo-Croatian | 5 | 0 | 5 | 60 | 30 | 30 |
| Shanghainese | 5 | 0 | 5 | 5 | 5 | 0 |
| Sign languages, n.i.e. | 15 | 10 | 0 | 190 | 95 | 90 |
| Sindhi | 10 | 5 | 5 | 40 | 25 | 20 |
| Sinhala (Sinhalese) | 10 | 10 | 5 | 95 | 45 | 45 |
| Sino-Tibetan languages, n.i.e. | 0 | 0 | 0 | 535 | 280 | 255 |
| Slavic languages, n.i.e. | 0 | 0 | 0 | 235 | 125 | 110 |
| Slovak | 5 | 0 | 0 | 20 | 15 | 10 |
| Slovenian | 45 | 20 | 25 | 10 | 5 | 5 |
| Somali | 5 | 0 | 0 | 315 | 140 | 180 |
| Spanish | 7,165 | 3,410 | 3,750 | 1,590 | 845 | 745 |
| Swahili | 10 | 5 | 5 | 125 | 65 | 55 |
| Swedish | 0 | 0 | 0 | 15 | 10 | 5 |
| Tagalog (Pilipino, Filipino) | 20 | 10 | 10 | 5,645 | 2,810 | 2,840 |
| Taiwanese | 0 | 0 | 0 | 15 | 10 | 10 |
| Tamil | 650 | 315 | 325 | 115 | 70 | 45 |
| Telugu | 0 | 0 | 0 | 90 | 55 | 35 |
| Thai | 20 | 5 | 10 | 50 | 25 | 25 |
| Tibetan languages | 0 | 0 | 0 | 0 | 0 | 0 |
| Tigrigna | 0 | 0 | 0 | 190 | 85 | 100 |
| Turkish | 795 | 395 | 395 | 125 | 65 | 60 |
| Ukrainian | 185 | 75 | 115 | 1,635 | 800 | 835 |
| Urdu | 90 | 50 | 40 | 2,405 | 1,275 | 1,130 |
| Vietnamese | 2,355 | 1,125 | 1,230 | 1,270 | 640 | 635 |
| Yiddish | 0 | 0 | 0 | 0 | 5 | 0 |
| Other languagesCensus data footnote 22 | 165 | 75 | 85 | 550 | 275 | 275 |
| Multiple responses | 13,380 | 6,545 | 6,840 | 16,610 | 8,085 | 8,525 |
| English and French | 1,190 | 565 | 625 | 855 | 400 | 460 |
| English and non-official language | 1,590 | 790 | 805 | 15,360 | 7,500 | 7,860 |
| French and non-official language | 9,070 | 4,385 | 4,690 | 205 | 110 | 95 |
| English, French and non-official language | 1,530 | 805 | 720 | 185 | 75 | 110 |
| Detailed other language spoken regularly at home | ||||||
| Detailed other language spoken regularly at home - Total population excluding institutional residentsCensus data footnote 19 | 108,590 | 51,790 | 56,800 | 1,018,310 | 505,085 | 513,225 |
| None | 67,685 | 31,965 | 35,725 | 939,390 | 466,505 | 472,885 |
| Single responses | 37,240 | 18,005 | 19,240 | 77,380 | 37,800 | 39,580 |
| English | 5,495 | 2,720 | 2,775 | 29,695 | 15,050 | 14,645 |
| French | 13,905 | 6,695 | 7,210 | 8,320 | 3,635 | 4,685 |
| Non-official languages | 17,835 | 8,585 | 9,250 | 39,370 | 19,120 | 20,255 |
| Selected Aboriginal languagesCensus data footnote 20 | 5 | 5 | 5 | 12,375 | 5,935 | 6,440 |
| Atikamekw | 0 | 0 | 0 | 0 | 0 | 0 |
| Cree, n.o.s. | 5 | 5 | 0 | 10,020 | 4,810 | 5,210 |
| Dene | 0 | 0 | 0 | 1,875 | 895 | 975 |
| Innu/Montagnais | 5 | 0 | 5 | 0 | 0 | 0 |
| Inuktitut | 0 | 0 | 0 | 15 | 5 | 10 |
| Mi'kmaq | 0 | 0 | 0 | 0 | 0 | 0 |
| Ojibway | 0 | 0 | 0 | 455 | 225 | 230 |
| Oji-Cree | 0 | 0 | 0 | 5 | 5 | 5 |
| Stoney | 0 | 0 | 0 | 5 | 0 | 5 |
| Selected non-Aboriginal languagesCensus data footnote 21 | 17,640 | 8,485 | 9,155 | 26,080 | 12,750 | 13,325 |
| African languages, n.i.e. | 5 | 5 | 0 | 145 | 85 | 70 |
| Afrikaans | 0 | 0 | 0 | 270 | 140 | 125 |
| Akan (Twi) | 5 | 5 | 0 | 50 | 25 | 25 |
| Albanian | 10 | 5 | 10 | 30 | 15 | 15 |
| Amharic | 0 | 0 | 5 | 55 | 40 | 20 |
| Arabic | 3,200 | 1,645 | 1,555 | 750 | 430 | 320 |
| Armenian | 10 | 5 | 5 | 0 | 0 | 0 |
| Bantu languages, n.i.e. | 45 | 20 | 20 | 130 | 70 | 60 |
| Bengali | 50 | 30 | 20 | 200 | 115 | 80 |
| Berber languages (Kabyle) | 235 | 120 | 115 | 0 | 0 | 0 |
| Bisayan languages | 0 | 0 | 5 | 150 | 55 | 95 |
| Bosnian | 0 | 0 | 0 | 80 | 35 | 50 |
| Bulgarian | 20 | 5 | 5 | 20 | 10 | 10 |
| Burmese | 0 | 0 | 0 | 45 | 30 | 15 |
| Cantonese | 60 | 20 | 35 | 545 | 290 | 255 |
| Chinese, n.o.s. | 270 | 120 | 150 | 1,115 | 570 | 545 |
| Creoles | 3,340 | 1,480 | 1,860 | 75 | 35 | 40 |
| Croatian | 5 | 0 | 0 | 100 | 50 | 50 |
| Czech | 10 | 0 | 5 | 55 | 25 | 30 |
| Danish | 0 | 0 | 0 | 80 | 45 | 35 |
| Dutch | 5 | 0 | 5 | 445 | 215 | 225 |
| Estonian | 0 | 0 | 0 | 5 | 0 | 5 |
| Finnish | 0 | 0 | 0 | 65 | 25 | 35 |
| Flemish | 0 | 5 | 5 | 10 | 5 | 5 |
| Fukien | 0 | 0 | 0 | 0 | 0 | 0 |
| German | 35 | 15 | 20 | 4,650 | 2,275 | 2,375 |
| Greek | 110 | 55 | 60 | 510 | 265 | 250 |
| Gujarati | 5 | 5 | 10 | 170 | 110 | 60 |
| Hakka | 0 | 0 | 0 | 0 | 0 | 0 |
| Hebrew | 0 | 0 | 0 | 70 | 35 | 35 |
| Hindi | 10 | 0 | 5 | 540 | 325 | 215 |
| Hungarian | 10 | 5 | 5 | 395 | 200 | 200 |
| Ilocano | 0 | 0 | 0 | 85 | 25 | 60 |
| Indo-Iranian languages, n.i.e. | 10 | 5 | 0 | 50 | 30 | 20 |
| Italian | 6,085 | 2,940 | 3,140 | 265 | 145 | 120 |
| Japanese | 5 | 5 | 5 | 200 | 95 | 100 |
| Khmer (Cambodian) | 255 | 130 | 125 | 50 | 25 | 30 |
| Korean | 0 | 0 | 0 | 210 | 105 | 110 |
| Kurdish | 50 | 25 | 25 | 45 | 20 | 20 |
| Lao | 55 | 25 | 30 | 85 | 50 | 35 |
| Latvian | 0 | 0 | 0 | 10 | 5 | 5 |
| Lingala | 195 | 90 | 105 | 30 | 15 | 20 |
| Lithuanian | 5 | 5 | 0 | 5 | 0 | 0 |
| Macedonian | 0 | 0 | 0 | 5 | 5 | 0 |
| Malay | 5 | 5 | 5 | 50 | 25 | 20 |
| Malayalam | 0 | 0 | 0 | 55 | 35 | 25 |
| Maltese | 0 | 0 | 0 | 0 | 5 | 0 |
| Mandarin | 30 | 10 | 20 | 320 | 145 | 170 |
| Marathi | 0 | 0 | 0 | 25 | 15 | 15 |
| Nepali | 0 | 0 | 0 | 30 | 15 | 15 |
| Niger-Congo languages, n.i.e. | 65 | 25 | 40 | 310 | 155 | 155 |
| Norwegian | 0 | 0 | 0 | 95 | 35 | 60 |
| Oromo | 290 | 160 | 130 | 20 | 10 | 10 |
| Panjabi (Punjabi) | 5 | 5 | 5 | 625 | 370 | 255 |
| Pashto | 0 | 0 | 0 | 60 | 35 | 20 |
| Persian (Farsi) | 30 | 20 | 15 | 240 | 140 | 105 |
| Polish | 75 | 25 | 55 | 465 | 205 | 265 |
| Portuguese | 325 | 160 | 165 | 215 | 95 | 115 |
| Romanian | 75 | 35 | 40 | 200 | 100 | 95 |
| Rundi (Kirundi) | 5 | 5 | 0 | 30 | 15 | 15 |
| Russian | 60 | 30 | 35 | 665 | 315 | 350 |
| Rwanda (Kinyarwanda) | 40 | 15 | 25 | 20 | 15 | 5 |
| Semitic languages, n.i.e. | 5 | 5 | 0 | 115 | 60 | 55 |
| Serbian | 5 | 5 | 5 | 105 | 50 | 50 |
| Serbo-Croatian | 5 | 0 | 0 | 40 | 20 | 15 |
| Shanghainese | 0 | 0 | 0 | 5 | 5 | 0 |
| Sign languages, n.i.e. | 5 | 0 | 5 | 190 | 95 | 95 |
| Sindhi | 0 | 0 | 0 | 10 | 5 | 10 |
| Sinhala (Sinhalese) | 0 | 0 | 0 | 60 | 30 | 30 |
| Sino-Tibetan languages, n.i.e. | 0 | 0 | 5 | 45 | 20 | 20 |
| Slavic languages, n.i.e. | 5 | 5 | 0 | 35 | 20 | 15 |
| Slovak | 5 | 0 | 5 | 30 | 20 | 10 |
| Slovenian | 20 | 10 | 15 | 15 | 5 | 5 |
| Somali | 10 | 0 | 5 | 70 | 40 | 25 |
| Spanish | 1,730 | 835 | 890 | 1,865 | 915 | 955 |
| Swahili | 40 | 20 | 25 | 120 | 65 | 55 |
| Swedish | 0 | 0 | 0 | 65 | 30 | 35 |
| Tagalog (Pilipino, Filipino) | 30 | 5 | 25 | 2,325 | 1,020 | 1,305 |
| Taiwanese | 0 | 0 | 0 | 20 | 5 | 15 |
| Tamil | 55 | 25 | 30 | 115 | 65 | 45 |
| Telugu | 0 | 0 | 0 | 70 | 45 | 25 |
| Thai | 15 | 5 | 10 | 60 | 25 | 40 |
| Tibetan languages | 0 | 0 | 0 | 5 | 5 | 0 |
| Tigrigna | 0 | 0 | 0 | 105 | 45 | 60 |
| Turkish | 110 | 55 | 60 | 50 | 25 | 20 |
| Ukrainian | 75 | 30 | 45 | 4,225 | 1,805 | 2,420 |
| Urdu | 20 | 10 | 5 | 700 | 370 | 335 |
| Vietnamese | 390 | 215 | 180 | 395 | 195 | 205 |
| Yiddish | 0 | 0 | 0 | 5 | 5 | 0 |
| Other languagesCensus data footnote 22 | 190 | 95 | 90 | 915 | 430 | 485 |
| Multiple responses | 3,665 | 1,825 | 1,840 | 1,540 | 775 | 765 |
| English and French | 1,385 | 720 | 670 | 115 | 60 | 55 |
| English and non-official language | 765 | 375 | 390 | 495 | 265 | 235 |
| French and non-official language | 1,485 | 715 | 770 | 920 | 445 | 475 |
| English, French and non-official language | 35 | 15 | 15 | 10 | 5 | 5 |
Symbols
A adjusted figure due to boundary change
Users wishing to compare 2011 Census data with those of other censuses should then take into account that the boundaries of geographic areas may change from one census to another. In order to facilitate comparison, the 2006 Census counts are adjusted as needed to take into account boundary changes between the 2006 and 2011 censuses. The 2006 counts that were adjusted are identified by the letter 'A.' The letter 'A' may also refer to corrections to the 2006 counts; however, most of these are the result of boundary changes. This symbol is also used to identify areas that have been created since 2006, such as newly incorporated municipalities (census subdivisions) and new designated places (DPLs).
E use with caution
After the release of the 2006 or 2011 Census population and dwelling counts, errors are occasionally uncovered in the data. It is not possible to make changes to the 2006 or 2011 Census data presented in these tables.
Refer to the 2006 population and dwelling count amendments or the 2011 population and dwelling count amendments for further information.
X area and data suppression
In addition to random rounding, area and data suppression has been adopted to further protect the confidentiality of individual respondents' personal information.
Area and data suppression results in the deletion of all information for geographic areas with populations below a specified size. For example, areas with a population of less than 40 persons are suppressed. If the community searched has a population of less than 40 persons, only the total population counts will be available.
Geographic area suppression lists show areas where data are suppressed.
† excludes census data for one or more incompletely enumerated Indian reserves or Indian settlements
Excludes census data for one or more incompletely enumerated Indian reserves or Indian settlements (For further information, see the 'Notes.')
¶ incompletely enumerated Indian reserve and Indian settlement (For further information, see the 'Notes.')
Refer to a complete list of these geographic areas.
.. not available for a specific reference period
Data quality index: Data quality index showing a global non response rate higher than or equal to 25% (suppressed). Geographic area suppression lists show areas where data are suppressed.
Incompletely enumerated Indian reserve and Indian settlement: There were 13 Indian reserves and Indian settlements where enumeration was not possible as a result of forest fires in Northern Ontario at the time of census collection. Collection for these communities was done at a later time. While the data are not included in the 2011 Census tabulations, it is expected that separate special tables showing data for these communities will be made available at a later date, subject to data quality evaluation. Refer to a complete list of these geographic areas.
... not applicable
A possible reason for the use of the three dots (...) symbol is:
- A value that cannot be calculated such as a percentage change where the denominator is zero.
Footnotes
- Footnote 1
-
2011 and 2006 population
Statistics Canada is committed to protect the privacy of all Canadians and the confidentiality of the data they provide to us. As part of this commitment, some population counts of geographic areas are adjusted in order to ensure confidentiality.
Counts of the total population are rounded to a base of 5 for any dissemination block having a population of less than 15. Population counts for all standard geographic areas above the dissemination block level are derived by summing the adjusted dissemination block counts. The adjustment of dissemination block counts is controlled to ensure that the population counts for dissemination areas will always be within 5 of the actual values. The adjustment has no impact on the population counts of census divisions and large census subdivisions.
- Footnote 2
-
Total private dwellings
A separate set of living quarters designed for or converted for human habitation in which a person or group of persons reside or could reside. In addition, a private dwelling must have a source of heat or power and must be an enclosed space that provides shelter from the elements, as evidenced by complete and enclosed walls and roof, and by doors and windows that provide protection from wind, rain and snow.
- Footnote 3
-
Private dwellings occupied by usual residents
A separate set of living quarters which has a private entrance either directly from outside or from a common hall, lobby, vestibule or stairway leading to the outside, and in which a person or a group of persons live permanently.
- Footnote 4
-
Age
Refers to the age at last birthday before the reference date, that is, before May 10, 2011.
Refer to the Census Dictionary for more information.
- Footnote 5
-
Median age
The median age is an age 'x', such that exactly one half of the population is older than 'x' and the other half is younger than 'x'.
- Footnote 6
-
Total population 15 years and over by marital status
Refers to the marital status of the person, taking into account his/her common-law status. For more information, refer to the Census Dictionary: Marital status.
- Footnote 7
-
Total number of census families in private households
Census family - Refers to a married couple (with or without children), a common-law couple (with or without children) or a lone parent family. For more information, refer to the Census Dictionary: Census family.
- Footnote 8
-
Total number of census families in private households
Census family structure - Refers to the classification of census families into married couples (with or without children of either and/or both spouses), common-law couples (with or without children of either and/or both partners), and lone-parent families by sex of parent. A couple may be of opposite or same sex. A couple with children may be further classified as either an intact family or stepfamily, and stepfamilies may, in turn, be classified as simple or complex. Children in a census family include grandchildren living with their grandparent(s) but with no parents present.
- Footnote 9
-
Living with relatives
Non-relatives may be present.
- Footnote 10
-
Total number of private households by household type
Refers to the basic division of private households into family and non-family households. Family household refers to a household that contains at least one census family, that is, a married couple with or without children, or a couple living common-law with or without children, or a lone parent living with one or more children (lone-parent family). One-family household refers to a single census family (with or without other persons) that occupies a private dwelling. Multiple-family household refers to a household in which two or more census families (with or without additional persons) occupy the same private dwelling. Family households may also be divided based on the presence of persons not in a census family.
Non-family household refers to either one person living alone in a private dwelling or to a group of two or more people who share a private dwelling, but who do not constitute a census family.
- Footnote 11
-
One-family-only households
Refers to households that consist solely of one census family without additional persons.
- Footnote 12
-
Couple-family households
Refers to households with opposite-sex or same-sex couples.
- Footnote 13
-
Other family households
Refers to one-census family households with additional persons and to multiple-census family households, with or without additional persons.
- Footnote 14
-
Couple-family households
Refers to households with opposite-sex or same-sex couples.
- Footnote 15
-
Total number of occupied private dwellings by structural type of dwelling
Structural type of dwelling - Characteristics that define a dwelling's structure, for example, the characteristics of a single-detached house, a semi-detached house, a row house, or an apartment or flat in a duplex. Refers to the structural characteristics and/or dwelling configuration, that is, whether the dwelling is a single-detached house, an apartment in a high-rise building, a row house, a mobile home, etc.
- Footnote 16
-
Movable dwelling
Includes mobile homes and other movable dwellings such as houseboats and railroad cars.
- Footnote 17
-
Other dwelling
The category 'Other dwelling' is a subtotal of the following categories: semi-detached house, row house, apartment or flat in a duplex, apartment in a building that has fewer than five storeys and other single-attached house.
- Footnote 18
-
Total number of private households by household size
Household, private - Person or group of persons occupying the same dwelling. Refers to a person or a group of persons (other than foreign residents) who occupy a private dwelling and do not have a usual place of residence elsewhere in Canada.
Household size - Number of persons occupying a private dwelling. Refers to the number of usual residents in a private household.
- Footnote 19
-
Total population excluding institutional residents
The population excluding institutional residents includes Canadian citizens (by birth or by naturalization) and landed immigrants (permanent residents) excluding those who live in institutions (institutional collective dwellings). Canadian citizens and landed immigrants either: (1) have a usual place of residence in Canada; (2) are abroad either on a military base or attached to a diplomatic mission; or (3) are at sea or in port aboard merchant vessels under Canadian registry or Canadian government vessels. Since 1991, the target population also includes persons with a usual place of residence in Canada who are claiming refugee status, who hold study permits, or who hold work permits, as well as family members living with them; for census purposes, this group is referred to as non-permanent residents. The population universe does not include foreign residents.
- Footnote 20
-
Selected Aboriginal languages
The languages shown were selected based on the Aboriginal mother tongues most often reported as single responses in Canada in the 2011 Census of Population.
- Footnote 21
-
Selected non-Aboriginal languages
The languages shown were selected based on the non-Aboriginal mother tongues (other than English or French) most often reported as single responses in Canada in the 2011 Census of Population.
- Footnote 22
-
Other languages
This is a subtotal of all languages collected by the census that are not displayed separately here. For a full list of languages collected in the census, please refer to Appendix D in the 2011 Census Dictionary.
- Footnote 23
-
Official language minority
English is the first official language spoken by Quebec's official language minority, which consists of all individuals with English as a first official language spoken and half of those with both English and French. French is the first official language spoken by the official language minority in the country overall and in every province and territory outside Quebec, which consists of all individuals with French as a first official language spoken and half of those with both English and French.
Source
Source: Statistics Canada, 2011 Census of Population.
How to cite
How to cite: Statistics Canada. 2012. Saint-Léonard - Saint-Michel, Quebec (Code 24067) and Saskatchewan (Code 47) (table). Census Profile. 2011 Census. Statistics Canada Catalogue no. 98-316-XWE. Ottawa. Released October 24, 2012.
http://www12.statcan.gc.ca/census-recensement/2011/dp-pd/prof/index.cfm?Lang=E (accessed May 5, 2024).
Download
Download
Information regarding available file formats
Option 1 – Download data table
Contains currently selected geographies (i.e., Saint-Léonard - Saint-Michel, Quebec and Saskatchewan) and topics in the 'Data table' tab.
CSV (comma-separated values) file
TAB (tab-separated values) file
Download a compressed CSV (comma-separated values) or a compressed TAB (tab-separated values) file for all geographies from a selected geographic level for all topics.
Option 3 – Comprehensive download files - IVT or XML file format
Download an IVT (Beyond 20/20) or a compressed XML (SDMX-ML) file for all geographies from a selected geographic level or groups of geographic levels for all topics.
Map
Map
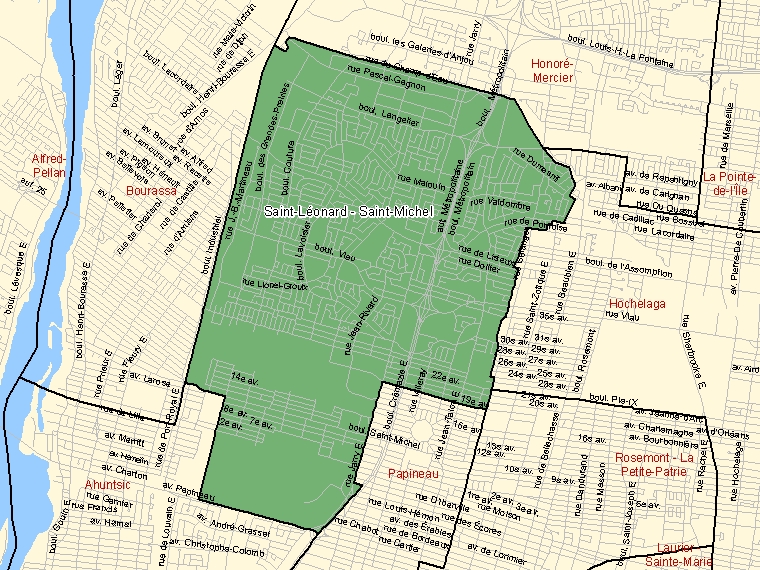
Map: Saint-Léonard - Saint-Michel (Federal electoral district, 2003 Representation Order), Quebec
Alternative format(s): pdf | ARCHIVED – Reference map (interactive tool)
Map: Saskatchewan
Alternative format(s): ARCHIVED – Reference map (interactive tool)

Geographic hierarchy
Geographic hierarchy
Geographic hierarchy: Saint-Léonard - Saint-Michel (Federal electoral district, 2003 Representation Order)
Geographic hierarchy: Saskatchewan (Province)
-
Canada
- Saskatchewan (Province)
Note
Note: For more information regarding geographic hierarchies, refer to the Illustrated Glossary: Hierarchy of standard geographic units tutorial.
Related data
Related data
Related data: Saint-Léonard - Saint-Michel (Federal electoral district, 2003 Representation Order), Quebec
2011 Census
- Topic-based tabulations, Saint-Léonard - Saint-Michel (Federal electoral district, 2003 Representation Order), Quebec
2011 National Household Survey (NHS)
Related data: Saskatchewan
2011 Census
- Topic-based tabulations, Saskatchewan
- Highlight tables, Canada, provinces and territories
- Focus on Geography, Saskatchewan
- Census Data Navigator, Saskatchewan
- Visual Census, Saskatchewan
2011 National Household Survey (NHS)
- Date modified: