
Archived Content
Information identified as archived is provided for reference, research or recordkeeping purposes. It is not subject to the Government of Canada Web Standards and has not been altered or updated since it was archived. Please contact us to request a format other than those available.
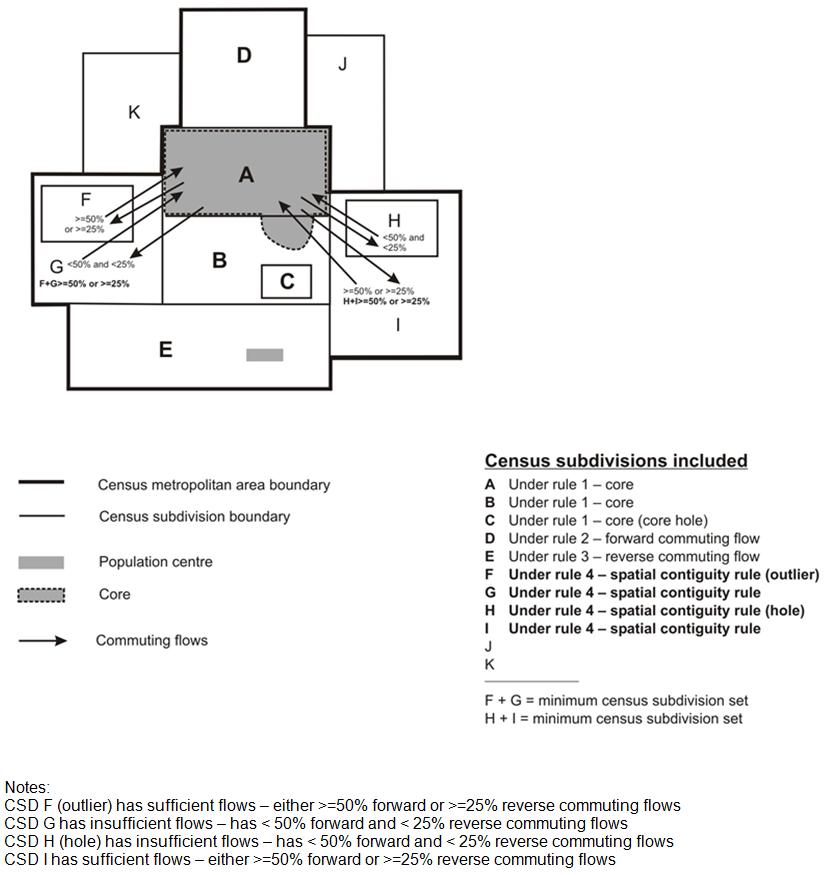
Figure 9 Spatial contiguity rule
Description
Figure 9 is a graphical representation of the spatial contiguity rule (rule 4) for delineating census metropolitan areas (CMAs) and census agglomerations (CAs). A fictional grouping of 11 census subdivisions (CSDs), shown as polygons labelled 'A' through 'K,' represent the group of CSDs that could form a CMA.
All of CSD A and a small portion of the adjacent CSD B are shaded to represent a population centre (POPCTR). This population centre also makes up the core of the CMA. Census subdivision E has a small, shaded polygon within it that identifies a population centre that is not part of the core.
Census subdivision G, which is adjacent to CSDs A and B (part of the CMA), is shown to have insufficient commuting flows (either forward or reverse). However, it completely contains a smaller CSD (CSD F) which is shown to have sufficient commuting flows. CSD F is considered to be an outlier. The combined commuting flows of CSD F and CSD G are shown to be sufficient to make them eligible for inclusion in the CMA. The commuting flows of these CSDs are represented in the figure by arrows leading to and from the delineation core (CSDs A, B, and C).
Census subdivision I, which is adjacent to CSDs A and B (part of the CMA), is shown to have sufficient commuting flows (either forward or reverse). However, it completely contains a smaller CSD (CSD H) which is shown to have insufficient commuting flows. CSD H is considered to be a hole. Like CSDs G and F, the combined commuting flows of these two CSDs (CSD H and CSD I) are shown to be sufficient to make them eligible for inclusion in the CMA. The commuting flows of these CSDs are represented in the figure by arrows leading to and from the delineation core (CSDs A, B and C).
A thick black line outlines the perimeter of CSDs A, B, C, D, E, F, G, H and I to identify the new boundary of the CMA.
Two legends appear below the figure. The legend on the left identifies the symbols used in the figure for representing the CMA, CSD, POPCTR and core boundaries and the commuting flows. The legend on the right distinguishes which CSDs are included in the CMA by which rule. For this figure, CSDs A, B and C are included under rule 1 (core rule), CSD D is included under rule 2 (forward commuting flow rule), CSD E is included under rule 3 (reverse commuting flow rule), and CSDs F, G, H and I are included under rule 4 (spatial contiguity rule).
For more information on this figure, please contact Statistics Canada at 1-800-263-1136.
Source: Statistics Canada, 2011 Census of Population.
- Date modified: