
Disaggregated trends in poverty from the 2021 Census of Population
Skip to text
Text begins
Highlights
- Based on data from the 2021 Census of Population, the poverty rate in Canada was 8.1% in 2020, down from 14.5% in 2015.
- Poverty declined among all ages, but especially so for children. In 2020, the poverty rates of children aged 0 to 5 years (9.1%), 6 to 10 years (8.5%) and for youth aged 11 to 17 years (7.9%) were all less than half their levels in 2015.
- Declines in poverty were driven by higher government transfers in 2020, including the enhanced Canada Child Benefit (CCB) and temporary pandemic relief benefits.
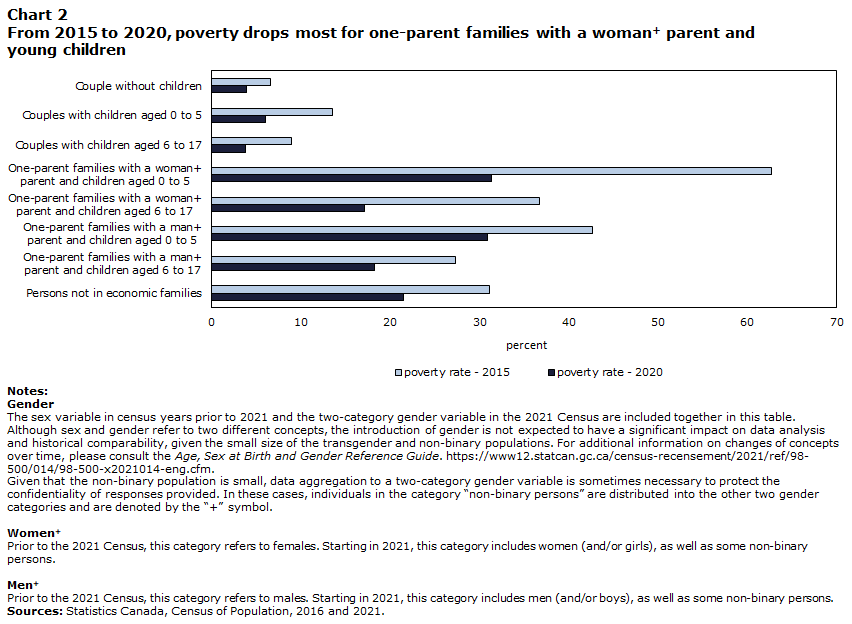
- In 2020, the poverty rate for one-parent families headed by a woman with a child aged 0 to 5 was 31.3%, the highest among all family types, and more than five times the rate of couple-families with a child of the same age (6.0%).
- From 2015 to 2020, the poverty rate for one-parent families headed by a woman with a child aged 0 to 5 fell by more than half, declining from 62.7% to 31.3%.
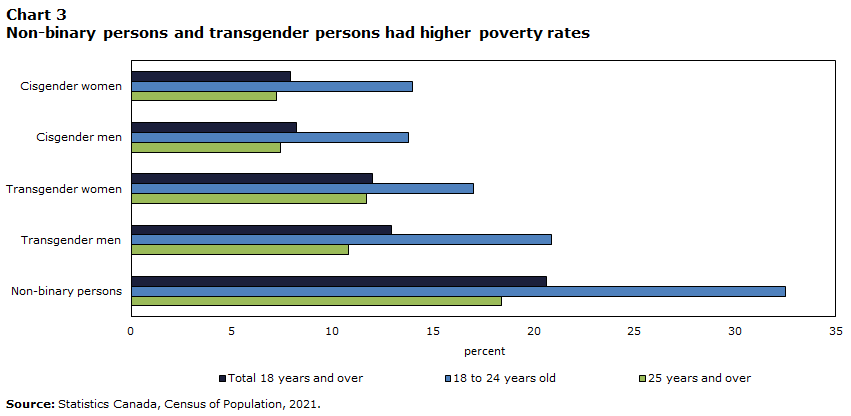
- There was little difference between the poverty rates of cisgender women (7.9%) and cisgender men (8.2%) in 2020. However, transgender men (12.9%) and women (12.0%), were more likely to experience poverty than their cisgender counterparts. More than one in five (20.6%) non-binary people lived in poverty, more than twice the national rate.
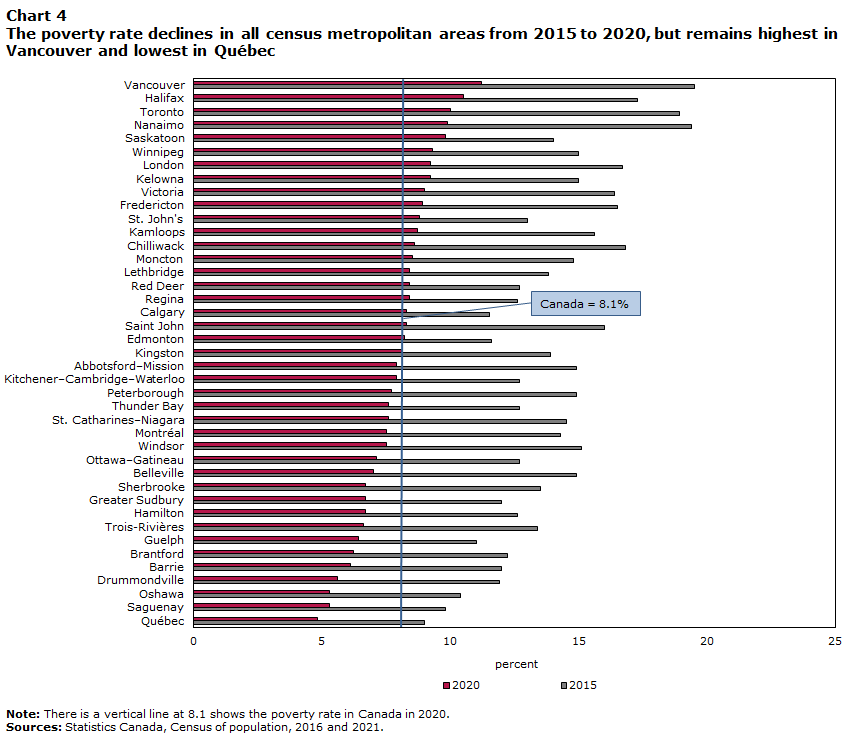
- Despite higher income levels, poverty was more prevalent in large urban areas, reflecting higher costs of living. Among large urban centres, the poverty rate was highest in Vancouver (11.2%), Halifax (10.5%) and Toronto (10.0%), and lowest in Québec (4.8%), Saguenay (5.3%) and Oshawa (5.3%).
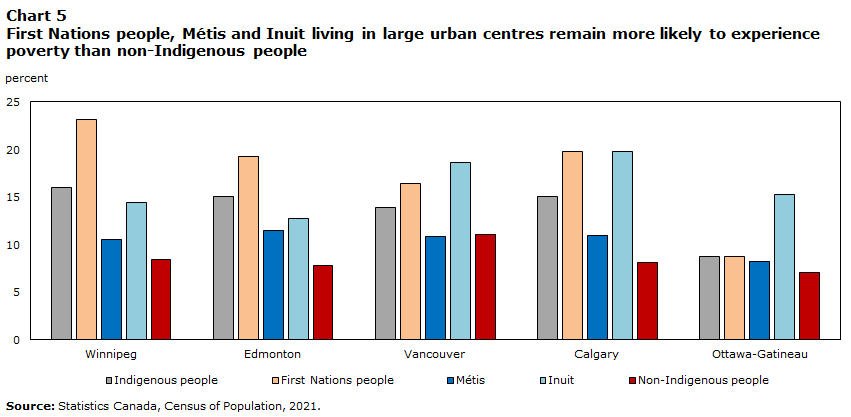
- Census data can help shed light on the poverty experiences of the growing urban Indigenous population. In Winnipeg, which has the largest Indigenous population of all urban centres in Canada, 23.2% of First Nations people, 10.5% of Métis and 14.4% of Inuit lived in poverty in 2020. By comparison, in 2015, the corresponding proportions were 44.0% of First Nations people, 19.7% of Métis and 27.3% of Inuit.
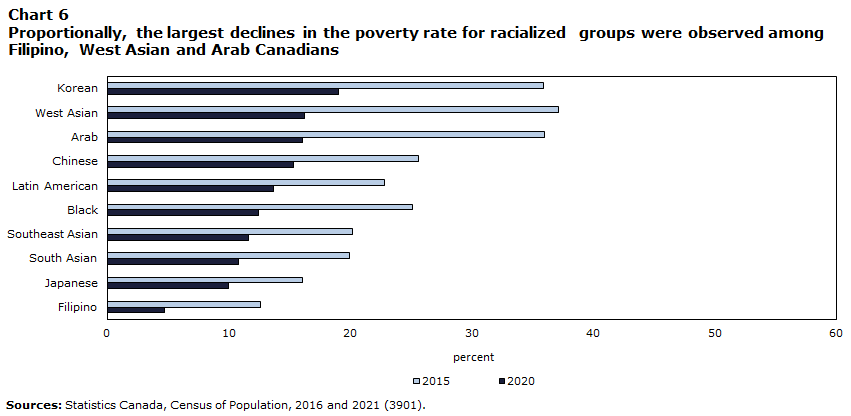
- Among racialized groups, 10.8% of South Asian, 15.3% of Chinese and 12.4% of Black Canadians lived in poverty in 2020. The prevalence of poverty varied markedly between racialized groupsNote 1 and regions. For example, the poverty rate among Black Canadians was 15.8% in Winnipeg and 9.7% in Montréal.
- From 2015 to 2020, notable declines in poverty rates were recorded for most racialized groups in most urban centres. However, there were considerable differences. For example, the poverty rate for Arab Canadians in Regina in 2020 (16.3%) was less than one-third of its 2015 level (57.1%). In contrast, the poverty rate for Latin American Canadians in Winnipeg varied much less, from 2015 (17.5%) to 2020 (15.9%).
- The poverty rate of immigrants declined by more than half from 2015 to 2020, falling from 18.8% to 9.1%. However, poverty was more prevalent among immigrants than among the Canadian-born population, particularly among refugees and recent immigrants (those who landed in the five years preceding the census year).
Introduction
The Poverty Reduction Act was adopted in June 2019. It set targets to reduce poverty in Canada and established the Market Basket Measure (MBM) as Canada’s Official Poverty Line. The targets align with the United Nations Sustainable Development Goal of ending poverty, in all its forms, everywhere.
The MBM considers the disposable income and size of Canadian families, as well as differing costs of shelter, food, clothing, footwear, transportation and other expenses for 53 MBM regions and communities in Canada. According to the MBM, a family is considered to be in poverty if, given its size and region of residence, it does not have enough income to buy a set of goods and services considered to represent a modest, basic standard of living.
The poverty rate in Canada was trending downward prior to the pandemic, falling from a peak of 14.5% in 2015 to 10.3% in 2019, according to survey data. The decline was driven by a combination of higher government transfers, including the Canada Child Benefit (CCB), and generally favourable labour market conditions. In 2019, the unemployment rate stood at 5.7%, its lowest level on record at the time.
On July 13, 2022, Statistics Canada released new income data from the 2021 Census of Population. This release highlighted how COVID-related benefits helped offset lost employment income during the first year of the pandemic, thereby increasing the after-tax income of households and lowering income inequality and the proportion of the population in a low income situation. COVID-related benefits included new temporary programs and one-time top-ups to several existing programs. Most of the major COVID-19 income support programs ended by the fall of 2021; the Canada Emergency Response Benefit (CERB) ended in September 2020 and the Canada Recovery Benefit in October 2021.
Despite these trends, many families have remained more vulnerable to situations of poverty. Populations vulnerable to poverty are at greater risk of facing hardship during economic shocks, such as during periods of reduced economic activity or accelerating inflation.
Data on Canada’s Official Poverty Line are available annually from the Canadian Income Survey and can be used to examine aggregate trends for Canada, the provinces and some population groups. However, the Census of Population is an ideal data source for examining disaggregated poverty trends for smaller geographies and a broad and diverse range of population groups, given its comprehensive coverage and large sample.
This Census in Brief article focuses on the experiences of poverty in Canada in 2020, based on data from the 2021 Census of Population. Trends by family type, gender, age, detailed geography, Indigenous identity, racialized group and immigrant status are presented. When possible, comparisons are made with data from the 2016 Census.
Poverty declines in all age groups, especially among children and youth
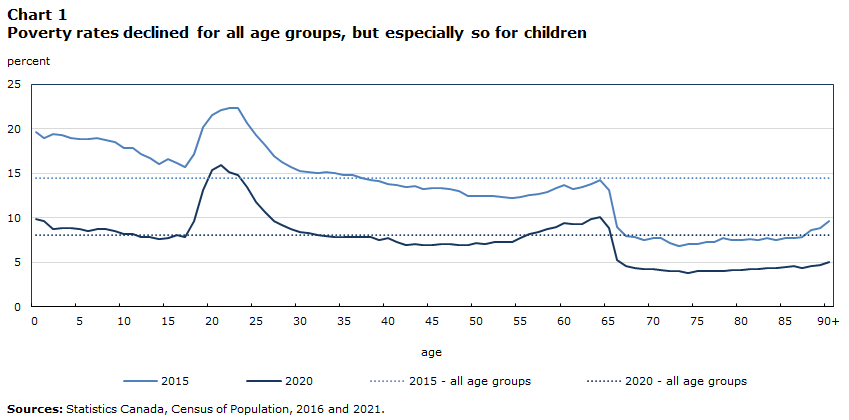
Based on data from the 2021 Census of Population, the poverty rate in Canada was 8.1% in 2020, down from 14.5% in 2015. Poverty decreased for people in all age groups during this period, but declines were larger among children and youth 17 years and under.
In 2020, the poverty rates of children 0 to 5 years (9.1%), 6 to 10 years (8.5%) and youth 11 to 17 year (7.9%) were all less than half their levels in 2015. Both higher payments from the Canada Child Benefit targeted at low- and middle-income families, and income from temporary pandemic relief benefits in 2020, contributed to significantly lowering child poverty during the first year of the pandemic.
Data table for chart 1
| 2015 | 2015 - all age groups | 2020 | 2020 - all age groups | |
|---|---|---|---|---|
| poverty rate (percent) | ||||
| 0 | 19.7 | 14.5 | 9.9 | 8.1 |
| 1 | 19.0 | 14.5 | 9.7 | 8.1 |
| 2 | 19.4 | 14.5 | 8.8 | 8.1 |
| 3 | 19.3 | 14.5 | 8.9 | 8.1 |
| 4 | 19.0 | 14.5 | 8.9 | 8.1 |
| 5 | 18.9 | 14.5 | 8.8 | 8.1 |
| 6 | 18.9 | 14.5 | 8.5 | 8.1 |
| 7 | 19.0 | 14.5 | 8.7 | 8.1 |
| 8 | 18.8 | 14.5 | 8.8 | 8.1 |
| 9 | 18.5 | 14.5 | 8.5 | 8.1 |
| 10 | 17.9 | 14.5 | 8.2 | 8.1 |
| 11 | 17.8 | 14.5 | 8.2 | 8.1 |
| 12 | 17.2 | 14.5 | 7.9 | 8.1 |
| 13 | 16.7 | 14.5 | 7.8 | 8.1 |
| 14 | 16.0 | 14.5 | 7.6 | 8.1 |
| 15 | 16.6 | 14.5 | 7.7 | 8.1 |
| 16 | 16.2 | 14.5 | 8.1 | 8.1 |
| 17 | 15.7 | 14.5 | 7.8 | 8.1 |
| 18 | 17.2 | 14.5 | 9.6 | 8.1 |
| 19 | 20.2 | 14.5 | 13.1 | 8.1 |
| 20 | 21.5 | 14.5 | 15.4 | 8.1 |
| 21 | 22.1 | 14.5 | 15.9 | 8.1 |
| 22 | 22.3 | 14.5 | 15.2 | 8.1 |
| 23 | 22.3 | 14.5 | 14.8 | 8.1 |
| 24 | 20.6 | 14.5 | 13.5 | 8.1 |
| 25 | 19.3 | 14.5 | 11.8 | 8.1 |
| 26 | 18.2 | 14.5 | 10.7 | 8.1 |
| 27 | 17.0 | 14.5 | 9.7 | 8.1 |
| 28 | 16.3 | 14.5 | 9.2 | 8.1 |
| 29 | 15.7 | 14.5 | 8.7 | 8.1 |
| 30 | 15.3 | 14.5 | 8.4 | 8.1 |
| 31 | 15.2 | 14.5 | 8.3 | 8.1 |
| 32 | 15.0 | 14.5 | 8.1 | 8.1 |
| 33 | 15.2 | 14.5 | 8.0 | 8.1 |
| 34 | 15.0 | 14.5 | 7.9 | 8.1 |
| 35 | 14.8 | 14.5 | 7.9 | 8.1 |
| 36 | 14.8 | 14.5 | 7.8 | 8.1 |
| 37 | 14.5 | 14.5 | 7.8 | 8.1 |
| 38 | 14.3 | 14.5 | 7.9 | 8.1 |
| 39 | 14.1 | 14.5 | 7.5 | 8.1 |
| 40 | 13.8 | 14.5 | 7.7 | 8.1 |
| 41 | 13.7 | 14.5 | 7.3 | 8.1 |
| 42 | 13.5 | 14.5 | 7.0 | 8.1 |
| 43 | 13.6 | 14.5 | 7.1 | 8.1 |
| 44 | 13.2 | 14.5 | 7.0 | 8.1 |
| 45 | 13.3 | 14.5 | 6.9 | 8.1 |
| 46 | 13.4 | 14.5 | 7.1 | 8.1 |
| 47 | 13.2 | 14.5 | 7.1 | 8.1 |
| 48 | 13.0 | 14.5 | 6.9 | 8.1 |
| 49 | 12.5 | 14.5 | 7.0 | 8.1 |
| 50 | 12.5 | 14.5 | 7.2 | 8.1 |
| 51 | 12.5 | 14.5 | 7.1 | 8.1 |
| 52 | 12.5 | 14.5 | 7.3 | 8.1 |
| 53 | 12.4 | 14.5 | 7.3 | 8.1 |
| 54 | 12.2 | 14.5 | 7.3 | 8.1 |
| 55 | 12.3 | 14.5 | 7.7 | 8.1 |
| 56 | 12.6 | 14.5 | 8.2 | 8.1 |
| 57 | 12.7 | 14.5 | 8.4 | 8.1 |
| 58 | 12.9 | 14.5 | 8.8 | 8.1 |
| 59 | 13.4 | 14.5 | 9.0 | 8.1 |
| 60 | 13.7 | 14.5 | 9.4 | 8.1 |
| 61 | 13.2 | 14.5 | 9.3 | 8.1 |
| 62 | 13.5 | 14.5 | 9.3 | 8.1 |
| 63 | 13.8 | 14.5 | 9.9 | 8.1 |
| 64 | 14.2 | 14.5 | 10.1 | 8.1 |
| 65 | 13.1 | 14.5 | 8.9 | 8.1 |
| 66 | 9.0 | 14.5 | 5.3 | 8.1 |
| 67 | 8.0 | 14.5 | 4.6 | 8.1 |
| 68 | 7.8 | 14.5 | 4.4 | 8.1 |
| 69 | 7.5 | 14.5 | 4.3 | 8.1 |
| 70 | 7.7 | 14.5 | 4.3 | 8.1 |
| 71 | 7.7 | 14.5 | 4.2 | 8.1 |
| 72 | 7.2 | 14.5 | 4.0 | 8.1 |
| 73 | 6.8 | 14.5 | 4.0 | 8.1 |
| 74 | 7.1 | 14.5 | 3.8 | 8.1 |
| 75 | 7.1 | 14.5 | 4.0 | 8.1 |
| 76 | 7.3 | 14.5 | 4.0 | 8.1 |
| 77 | 7.3 | 14.5 | 4.0 | 8.1 |
| 78 | 7.7 | 14.5 | 4.0 | 8.1 |
| 79 | 7.5 | 14.5 | 4.1 | 8.1 |
| 80 | 7.5 | 14.5 | 4.2 | 8.1 |
| 81 | 7.6 | 14.5 | 4.3 | 8.1 |
| 82 | 7.5 | 14.5 | 4.3 | 8.1 |
| 83 | 7.7 | 14.5 | 4.4 | 8.1 |
| 84 | 7.5 | 14.5 | 4.4 | 8.1 |
| 85 | 7.7 | 14.5 | 4.5 | 8.1 |
| 86 | 7.7 | 14.5 | 4.6 | 8.1 |
| 87 | 7.8 | 14.5 | 4.4 | 8.1 |
| 88 | 8.6 | 14.5 | 4.6 | 8.1 |
| 89 | 8.9 | 14.5 | 4.7 | 8.1 |
| 90+ | 9.7 | 14.5 | 5.0 | 8.1 |
| Sources: Statistics Canada, Census of Population, 2016 and 2021. | ||||
The poverty rate among young adults aged 18 to 24 was 14.0% in 2020, down from 20.9% five years earlier. However, it was the highest among all age groups, reflecting the record share of young adults living alone. Over the past two decades, the proportion of young adults sharing their home with at least one parent or living with roommates or alone has grown markedly, while the share living with their spouse, partner or child has decreased.
More than half (53.3%) of young adults who were living alone or with other non-family persons lived in poverty in 2020. In contrast, the poverty rate for young adults living with family members was 5.6%.
Poverty was also more prevalent among people approaching retirement age (9.0% for adults 55 to 64 years) than among core-working age adults (7.9% for those 25 to 54 years). Moreover, owing to a well-established social security system for seniors in Canada, the poverty rate of people aged 65 and older (4.7%) was lower than for all other age groups.
In addition to private and public pension plans, Canadians 65 years and older with lower incomes are eligible to receive the Guaranteed Income Supplement. These income sources afford many seniors the opportunity to maintain a basic standard of living and stay out of poverty.
One-parent families with young children are almost five times more likely to experience poverty than couples with children of the same age
From 2015 top 2020, the poverty rate declined for Canadians living in all types of families, but especially for those living in families with children. Among couples with children aged 0 to 5, the poverty rate decreased from 13.5% in 2015 to 6.0% in 2020, while for those whose youngest child was aged 6 to 17, it fell from 8.9% to 3.8%. In each case, the poverty rate in 2020 was less than half its 2015 level.
These declines in the poverty rates were largely driven by increased government transfers in 2020, including the enhanced CCB and pandemic relief benefits.
The same factors also contributed to lowering poverty among one-parent families. For example, the poverty rate of persons living in one-parent families headed by a woman and with a child aged 0 to 5 was 31.3% in 2020, down from 62.7% in 2015. Nevertheless, as in 2015, poverty rates in 2020 of persons living in one-parent families with a child 0 to 5 years were highest among all family types.
Data table for chart 2
| Family type | poverty rate - 2015 | poverty rate - 2020 |
|---|---|---|
| percent | ||
| Couple without children | 6.6 | 3.9 |
| Couples with children aged 0 to 5 | 13.5 | 6.0 |
| Couples with children aged 6 to 17 | 8.9 | 3.8 |
| One-parent families with a woman+ parent and children aged 0 to 5 |
62.7 | 31.3 |
| One-parent families with a woman+ parent and children aged 6 to 17 |
36.7 | 17.1 |
| One-parent families with a man+ parent and children aged 0 to 5 |
42.7 | 30.9 |
| One-parent families with a man+ parent and children aged 6 to 17 |
27.3 | 18.2 |
| Persons not in economic families | 31.1 | 21.5 |
|
Notes: Gender The sex variable in census years prior to 2021 and the two-category gender variable in the 2021 Census are included together in this table. Although sex and gender refer to two different concepts, the introduction of gender is not expected to have a significant impact on data analysis and historical comparability, given the small size of the transgender and non-binary populations. For additional information on changes of concepts over time, please consult the Age, Sex at Birth and Gender Reference Guide. Given that the non-binary population is small, data aggregation to a two-category gender variable is sometimes necessary to protect the confidentiality of responses provided. In these cases, individuals in the category “non-binary persons” are distributed into the other two gender categories and are denoted by the “+” symbol. Women+ Prior to the 2021 Census, this category refers to females. Starting in 2021, this category includes women (and/or girls), as well as some non-binary persons. Men+ Prior to the 2021 Census, this category refers to males. Starting in 2021, this category includes men (and/or boys), as well as some non-binary persons. Sources: Statistics Canada, Census of Population, 2016 and 2021. |
||
Canadians living alone were also much more likely to experience poverty. In 2020, more than one in five (21.5%) Canadians not living in an economic family were in poverty, down from 31.1% in 2015. Persons not living in an economic family consist of those who live alone or with non-relatives (such as roommates). Over one in seven (15.0%) Canadian adults lived alone in 2021—the largest proportion ever recorded—and roommate households represented the fastest growing household type. Persons living alone generally face a higher cost of living relative to persons living in families, where resources can be pooled and costs shared.
More than one in five non-binary people live in poverty
A new question on gender was introduced in the 2021 Census of Population, to help fill a data gap on the gender diversity of the population and to allow more people in Canada to see themselves in the census.
Statistics Canada published the first census results on the gender diversity of the Canadian population on April 27, 2022. According to the findings, in 2021, close to 60,000 people in Canada aged 15 and older were transgender, and more than 40,000 were non-binary. Compared with the cisgender population, transgender and non-binary people were generally younger.
The new question on gender can help shed light on the experiences of poverty of cisgender and transgender women and men and the non-binary population.
Transgender and non-binary people were more likely to experience poverty than cisgender people. In 2020, the poverty rate among transgender women was 12.0%, while for transgender men the rate was 12.9%. These proportions are considerably higher than those for cisgender women (7.9%) and cisgender men (8.2%). However, non-binary people were most likely to experience poverty with a rate of 20.6%, more than twice the rates for cisgender women and men.
The younger age structure of the transgender and non-binary populations may partly explain their greater likelihood of experiencing poverty. Other factors may contribute as well. For example, in a Statistics Canada study conducted during the first year of the pandemic, transgender and non-binary participants were much more likely than other participants to report experiences of discrimination.Note 2
Younger adults are generally more likely to live in poverty than older adults, a finding also observed among the transgender and non-binary populations. The poverty rate of transgender people aged 18 to 24 was 19.3%, compared with 11.3% for those 25 years and older. Similarly, 32.5% of non-binary people aged 18 to 24 old were in poverty in 2020, compared with 18.4% of those 25 and older.
Data table for chart 3
| Total 18 years and over | 18 to 24 years old | 25 years and over | |
|---|---|---|---|
| percent | |||
| Cisgender women | 7.9 | 14.0 | 7.2 |
| Cisgender men | 8.2 | 13.8 | 7.4 |
| Transgender women | 12.0 | 17.0 | 11.7 |
| Transgender men | 12.9 | 20.9 | 10.8 |
| Non-binary persons | 20.6 | 32.5 | 18.4 |
| Source: Statistics Canada, Census of Population, 2021. | |||
Poverty is less prevalent in Quebec, reflecting a lower cost of living
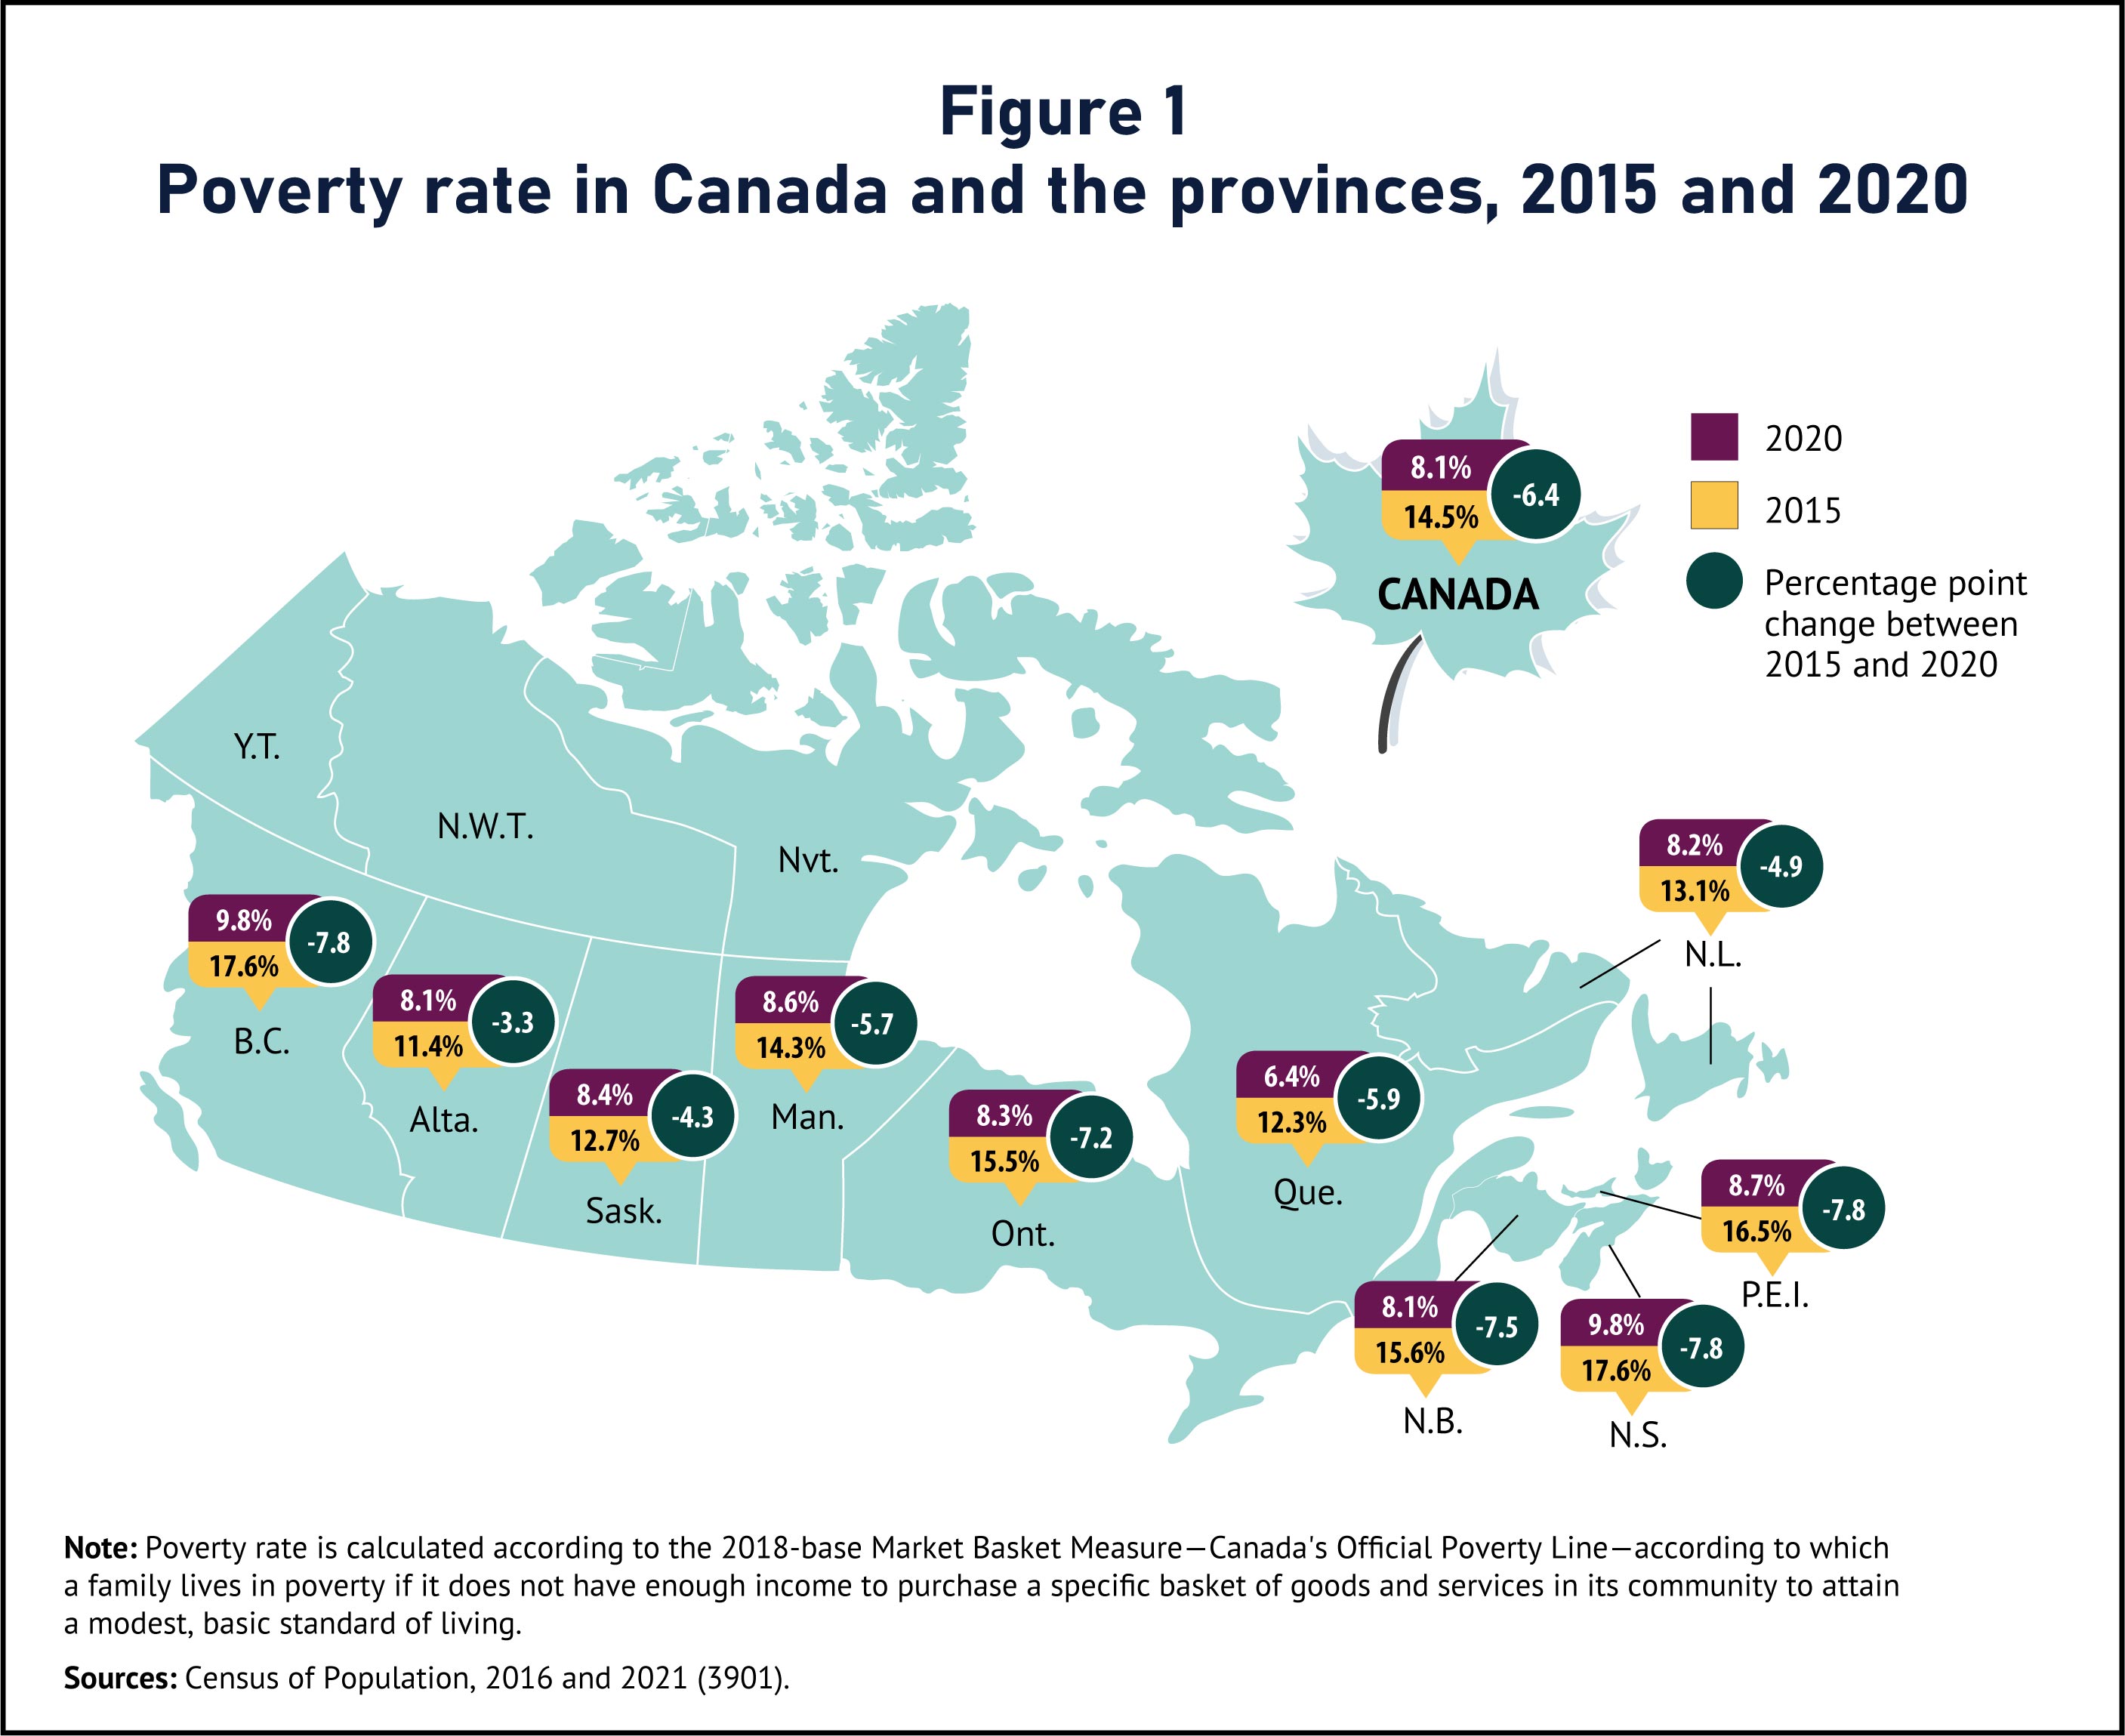
From 2015 to 2020, the poverty rate declined in all provinces. As in 2015, the poverty rate in Quebec (6.4%) in 2020 was significantly lower than in other provinces. In fact, in 2020, Quebec was the only province with a rate below the national average of 8.1%. In Quebec, the cost to maintain a modest, basic standard of living was lower than in other parts of the country. For example, the subsidized childcare program in Quebec reduces childcare costs and facilitates labour force participation among women.
Nova Scotia and British Columbia (9.8% each) had the highest poverty rates among the provinces, while the rates in the other provinces were closer to the national average (8.1%). In Ontario, the poverty rate in 2020 was 8.3%, down from 15.5% in 2015.
Description for map
The title of the map is "Poverty rate in Canada and the provinces, 2015 and 2020"
This is a map of Canada showing the poverty rate by provinces in 2015 and 2020, and the percentage point changes between 2015 and 2020.
In Canada, the poverty rate in 2020 was 8.1%, and it fell 6.4 percentage points from 14.5% in 2015.
In Newfoundland and Labrador, the poverty rate in 2020 was 8.2%, and it fell 4.9 percentage points from 13.1% in 2015.
In Prince Edward Island, the poverty rate in 2020 was 8.7%, and it fell 7.8 percentage points from 16.5% in 2015.
In Nova Scotia, the poverty rate in 2020 was 9.8%, and it fell 7.8 percentage points from 17.6% in 2015.
In New Brunswick, the poverty rate in 2020 was 8.1%, and it fell 7.5 percentage points from 15.6% in 2015.
In Quebec, the poverty rate in 2020 was 6.4%, and it fell 5.9 percentage points from 12.3% in 2015.
In Ontario, the poverty rate in 2020 was 8.3%, and it fell 7.2 percentage points from 15.5% in 2015.
In Manitoba, the poverty rate in 2020 was 8.6%, and it fell 5.7 percentage points from 14.3% in 2015.
In Saskatchewan, the poverty rate in 2020 was 8.4%, and it fell 4.3 percentage points from 12.7% in 2015.
In Alberta, the poverty rate in 2020 was 8.1%, and it fell 3.3 percentage points from 11.4% in 2015.
In British Columbia, the poverty rate in 2020 was 9.8%, and it fell 7.8 percentage points from 17.6% in 2015.
Note: Poverty rate is calculated according to the 2018-base Market Basket Measure -- Canada's Official Poverty Line -- according to which a family lives in poverty if it does not have enough income to purchase a specific basket of goods and services in its community to attain a modest, basic standard of living.
Sources: Statistics Canada, Census of Population, 2016 and 2021 (3901).
The poverty rate falls in urban centres across Canada, but remains higher in large urban centres, especially in downtown cores
Despite having higher income levels, residents of large urban areas were more likely to experience poverty than residents of smaller population centres. This reflects significantly higher costs of living in large urban areas, particularly shelter costs. That said, the poverty rate of urban areas of all sizes and rural areas fell from 2015 to 2020.
Among large urban centres (those with a population of 100,000 or more, known as census metropolitan areasNote 3), the poverty rate in 2020 was highest in Vancouver (11.2%), Halifax (10.5%) and Toronto (10.0%). In contrast, poverty was about half as prevalent in Québec (4.8%), Saguenay (5.3%) and Oshawa (5.3%).
Among smaller urban centres (those with a population from 10,000 to 99,999, known as census agglomerations), the poverty rate was highest in Elliot Lake (10.8%), Wetaskiwin (10.6%) and Charlottetown (9.9%), and lowest in Petawawa (2.5%), Centre Wellington (3.4%) and Sainte-Marie (3.6%). In Canada’s rural areas, the poverty rate fell from 10.1% in 2015 to 5.6% in 2020.
In large urban centres, poverty is often concentrated in specific neighbourhoods, where more vulnerable populations such as racialized groups, recent immigrants, students, young adults and persons living alone or with roommates are more likely to live. For example, in Canada’s downtown cores, the poverty rate in 2020 was 18.6%, more than twice the overall rate in large urban areas as a whole (9.2%).
Data table for chart 4
| 2020 | 2015 | |
|---|---|---|
| percent | ||
| Vancouver | 11.2 | 19.5 |
| Halifax | 10.5 | 17.3 |
| Toronto | 10.0 | 18.9 |
| Nanaimo | 9.9 | 19.4 |
| Saskatoon | 9.8 | 14.0 |
| Winnipeg | 9.3 | 15.0 |
| London | 9.2 | 16.7 |
| Kelowna | 9.2 | 15.0 |
| Victoria | 9.0 | 16.4 |
| Fredericton | 8.9 | 16.5 |
| St. John's | 8.8 | 13.0 |
| Kamloops | 8.7 | 15.6 |
| Chilliwack | 8.6 | 16.8 |
| Moncton | 8.5 | 14.8 |
| Lethbridge | 8.4 | 13.8 |
| Red Deer | 8.4 | 12.7 |
| Regina | 8.4 | 12.6 |
| Calgary | 8.3 | 11.5 |
| Saint John | 8.3 | 16.0 |
| Edmonton | 8.2 | 11.6 |
| Kingston | 8.1 | 13.9 |
| Abbotsford–Mission | 7.9 | 14.9 |
| Kitchener–Cambridge–Waterloo | 7.9 | 12.7 |
| Peterborough | 7.7 | 14.9 |
| Thunder Bay | 7.6 | 12.7 |
| St. Catharines–Niagara | 7.6 | 14.5 |
| Montréal | 7.5 | 14.3 |
| Windsor | 7.5 | 15.1 |
| Ottawa–Gatineau | 7.1 | 12.7 |
| Belleville | 7.0 | 14.9 |
| Sherbrooke | 6.7 | 13.5 |
| Greater Sudbury | 6.7 | 12.0 |
| Hamilton | 6.7 | 12.6 |
| Trois-Rivières | 6.6 | 13.4 |
| Guelph | 6.4 | 11.0 |
| Brantford | 6.2 | 12.2 |
| Barrie | 6.1 | 12.0 |
| Drummondville | 5.6 | 11.9 |
| Oshawa | 5.3 | 10.4 |
| Saguenay | 5.3 | 9.8 |
| Québec | 4.8 | 9.0 |
|
Note: There is a vertical line at 8.1 shows the poverty rate in Canada in 2020. Sources: Statistics Canada, Census of population, 2016 and 2021. |
||
The poverty rate among Indigenous people declines from 2015 to 2020, but Indigenous people are more likely to experience poverty
The COVID-19 pandemic and the confirmation of unmarked graves at former residential school sites have brought renewed attention to the long-standing and ongoing socioeconomic inequities between Indigenous and non-Indigenous people. These inequities include a higher prevalence of poverty among First Nations people, Métis and Inuit, perpetuated by colonial policies and practices, including barriers to educational and economic opportunities.
The MBM is currently not available for reserves and the three territories.Note 4 However, census data and the MBM can be used to shed light on the experiences of poverty among First Nations people living off reserve, Métis and Inuit in the provinces, including the growing Indigenous population living in urban areas across the country.
In the provinces, the poverty rate for Indigenous people (excluding First Nations people living on reserve) fell from 23.8% in 2015 to 11.8% in 2020. Specifically, the rate was 14.1% among First Nations people living off reserve, 9.2% among Métis and 10.2% among Inuit in the provinces. The corresponding rate for the non-Indigenous population in the provinces in 2020 was 7.9%.
Mirroring the overall poverty trend in Canada during this period, the decrease was mostly driven by increased government transfers and temporary pandemic-related benefits. As a result, the poverty gap between Indigenous and non-Indigenous people from 2015 to 2020 varied little.
In Winnipeg, 16.0% of the 102,080 Indigenous people enumerated in the census were living in poverty in 2020,Note 5 almost twice the rate of non-Indigenous people (8.4%) and the highest rate of these five urban centres. In 2020, 23.2% of First Nations people, 10.5% of Métis and 14.4% of Inuit were living in poverty in Winnipeg. By comparison, 44.0% of First Nations people, 19.7% of Métis and 27.3% of Inuit were living in poverty in Winnipeg in 2015.
Data table for chart 5
| Indigenous people | First Nations people | Métis | Inuit | Non-Indigenous people | |
|---|---|---|---|---|---|
| percent | |||||
| Winnipeg | 16.0 | 23.2 | 10.5 | 14.4 | 8.4 |
| Edmonton | 15.1 | 19.3 | 11.5 | 12.8 | 7.8 |
| Vancouver | 13.9 | 16.4 | 10.9 | 18.6 | 11.1 |
| Calgary | 15.1 | 19.8 | 11.0 | 19.8 | 8.1 |
| Ottawa-Gatineau | 8.8 | 8.8 | 8.2 | 15.3 | 7.1 |
| Source: Statistics Canada, Census of Population, 2021. | |||||
The poverty rate among the 46,545 Indigenous people enumerated in Ottawa–Gatineau was 8.8% in 2020, still the lowest among the five CMAs with the largest Indigenous populations as was the case five years earlier (18.8%). The gap between the poverty rates of Indigenous (8.8%) and non-Indigenous (7.1%) people was also smaller in Ottawa–Gatineau than in the other CMAs. In 2020, 8.8% of First Nations people, 8.2% of Métis and 15.3% of Inuit in Ottawa–Gatineau lived in poverty.
Poverty among racialized groups varies significantly across Canada
In 2021, One in four people in Canada was part of a racialized group. The three largest racialized groups in Canada were South Asian (2.6 million people), Chinese (1.7 million people) and Black (1.5 million people) Canadians. Together, the three groups represented over 16.1% of Canada’s total population.
The poverty rate for all racialized groups declined from 2015 to 2020. Proportionally, Filipino Canadians saw the biggest decrease in their poverty rate (from 12.6% to 4.7%) during this period, while Japanese Canadians had the smallest decrease (from 16.1% to 10.0%).
Other than Filipino Canadians, the poverty rates in racialized groups were all significantly higher than the national rate of 8.1% in 2020. Close to one in five (19.0%) Korean Canadians lived in poverty in Canada, more than twice the national average and the highest rate among all racialized groups. Among South Asians, the poverty rate was 10.8% in 2020, while 15.3% of Chinese and 12.4% of Black Canadians were living in poverty in 2020.
The prevalence of poverty varied markedly by racialized group and region. For example, the poverty rate among Black Canadians was 15.8% in Winnipeg and 9.7% in Montréal. Among Chinese Canadians, the poverty rate was 16.7% in Vancouver compared with 9.9% in Calgary.
Although the prevalence of poverty for most racialized groups in most urban centres declined significantly from 2015 to 2020, there were notable differences. For example, the poverty rate for Arab Canadians in Regina in 2020 (16.3%) was less than one-third of its 2015 level (57.1%). In contrast, the poverty rate for Latin American Canadians in Winnipeg varied little from 2015 (17.5%) to 2020 (15.9%). These results highlight the diversity within each racialized group, and the unique situations associated with experiences of poverty in Canada’s urban centres.
Data table for chart 6
| 2015 | 2020 | |
|---|---|---|
| percent | ||
| Filipino | 12.6 | 4.7 |
| Japanese | 16.1 | 10.0 |
| South Asian | 19.9 | 10.8 |
| Southeast Asian | 20.2 | 11.6 |
| Black | 25.1 | 12.4 |
| Latin American | 22.8 | 13.7 |
| Chinese | 25.6 | 15.3 |
| Arab | 36.0 | 16.1 |
| West Asian | 37.1 | 16.2 |
| Korean | 35.9 | 19.0 |
|
Sources: Statistics Canada, Census of Population, 2016 and 2021 (3901). |
||
Refugees and recent immigrants are more vulnerable to poverty
The poverty rate of immigrants declined by more than half from 2015 to 2020 (from 18.8% to 9.1%). The corresponding rate of the Canadian-born population also declined albeit to a lesser extent, from 12.5% to 6.6%. As in previous censuses, the poverty rate was higher among refugees (13.8%).
Immigrants who recently landed in Canada are usually at higher risk of experiencing poverty, although more recent cohorts of new immigrants have generally fared better. In 2020, the poverty rate among those who had landed since 2016 was 16.1%, nearly two-and-a-half times the rate of those born in Canada. A record number of immigrants—over 1.3 million—were admitted in Canada from 2016 to 2021, representing 15.9% of the total immigrant population enumerated in the 2021 Census.
Over time, the poverty rate of immigrants tends to decrease, but a gap with the Canadian-born population remains. For example, the poverty rate of immigrants who, in 2021, had been in Canada for 10 years or more was 7.5% at the age of 30, 1.4 percentage points higher than the rate for those of the same age who were born in Canada.
Looking ahead
The prevalence of poverty decreased markedly from 2015 to 2020 for most population groups considered in this study. These decreases were driven by more government transfers, including permanent increases to the Canada Child Benefit, but mostly by income from temporary pandemic-related benefits.
Despite the declines observed during the last period between censuses, groups with a higher prevalence of poverty relative to the rest of the population in 2020 are more likely to experience hardship during periods of economic uncertainty and in the face of higher consumer prices.
As data from the 2021 Census have shown, these groups include unattached individuals, one-parent families, transgender and non-binary populations, those living in large urban centres, Indigenous people, racialized groups, refugees and recent immigrants.
Results also highlight the importance of considering the diversity of poverty experiences within each population group, as it often varies considerably between regions of the country.
Going forward, annual data from the Canadian Income Survey will shed light on poverty trends in the post-pandemic period, including the extent to which the lower poverty rates observed in 2020 will be sustained in 2021 and 2022, in the context of record-low unemployment and inflationary pressures not seen in decades. One aspect to monitor will be the relative contributions of different income sources, such as government transfers and wages and salaries, to future movements of the poverty rate.
Additional information
Key findings from the 2021 Census on the income of Canadians can be found in the Daily article released on July 13, 2022: Pandemic benefits cushion losses for low income earners and narrow income inequality – after-tax income grows across Canada except in Alberta and Newfoundland and Labrador.
A Census in Brief article titled “The contribution of pandemic-related benefits to the incomes of Canadians in 2020” was released on August 2, 2022.
Data products include the income results for a wide range of standard geographic areas, available through the Census Profile and data tables.
Maps showing poverty rates by census tract for census metropolitan areas when available will be accessible in thematic maps.
Reference materials are designed to help users make the most of census data. They include the Guide to the Census of Population, 2021, the Dictionary, Census of Population, 2021, and the 2021 Census of Population questionnaires. The Income Reference Guide is also available.
Acknowledgments
This report was prepared by André Bernard and Xuelin Zhang of Statistics Canada’s Centre for Income and Socioeconomic Well-being Statistics, with the assistance of other staff members in that centre, and the collaboration of members of the Census Subject Matter Secretariat, the Census Operations Division and the Communications and Dissemination Branch.
- Date modified: