
Census in Brief
Interprovincial and interregional migration of Canada’s French- and English-speaking populations
Skip to text
Text begins
Highlights
- Approximately 810,000 English speakers (first official language spoken) and 80,000 French speakers moved to a different province or territoryNote 1 in Canada during the period between the 2016 and 2021 censuses. The interprovincial migration rate was higher among English speakers (3.1%) than among French speakers (1.1%).
- For both English and French speakers, employment and family were the main reasons reported for moving to a different province, regardless of the province or territory of origin or destination.
- Interprovincial migration is part of the reality for some French-speaking minority populations. For example, less than a third of the French speakers who were living in Newfoundland and Labrador, Alberta, British Columbia or the territories in 2021 were born there. Moreover, half of French speakers who were born in Saskatchewan or British Columbia and most of those born in Newfoundland and Labrador were no longer living in their province of birth in 2021.
- In New Brunswick, net interprovincial migration for both English and French speakers was positive (i.e., more in-migrants than out-migrants) between the 2016 and 2021 censuses, in contrast to the trend of previous decades. One factor that contributed to reversing this trend is people born in New Brunswick moving back to the province.
- In Quebec, net interprovincial migration from 2016 to 2021 was close to zero (i.e., as many in-migrants as out-migrants), after decades in the negative. This is mainly because of the changes within the English-speaking population. The number of English speakers who left Quebec before the 2000s, especially in the 1960s and 1970s, was particularly high. However, in the past 20 years, fewer English speakers have left the province. In fact, from 2016 to 2021, the number of English-speaking in-migrants in particular rose and was almost on par with the number of out-migrants.
- In Ontario, net interprovincial migration of French speakers was practically nil for the period from 2016 to 2021. For English speakers, it was negative.
- The Ottawa region, including eastern Ontario, was the main destination of French speakers who left Quebec, Manitoba or Alberta. It is the most popular destination outside Quebec chosen by internal French-speaking migrants, with 18,000 people moving there between 2016 and 2021.
- In Alberta, the period from 2016 to 2021 saw negative interprovincial migration for the first time since the 1986-to-1991 intercensal period. About half of those who left Alberta—both English and French speakers—returned to their province of birth.
- The number of French speakers who moved to British Columbia increased. As a result, it was the only province, along with Quebec, where the French-speaking population rose from 2016 to 2021.
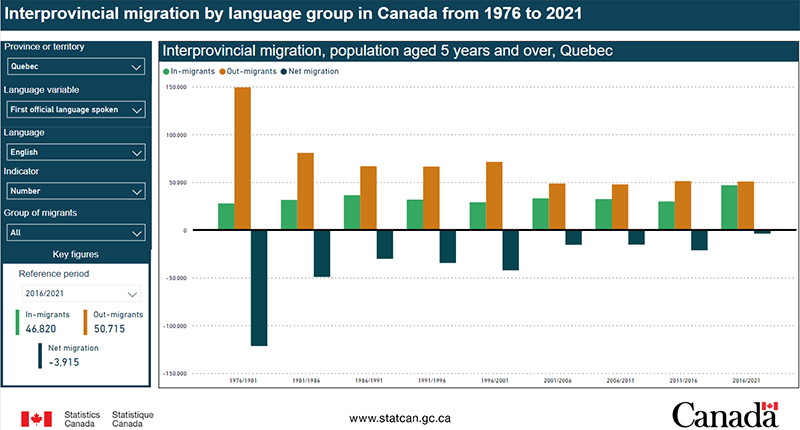
An interactive data visualization tool with information on interprovincial migration by mother tongue and first official language spoken for intercensal periods going from 1976–1981 to 2016–2021 is now available (Interprovincial migration by language group in Canada from 1976 to 2021, 71-607-X2023031).
Introduction
Throughout Canada’s history, migration flows have contributed to shaping and reshaping the country’s language geography. For example, internal migration has shaped the minority official language communities in Canada—i.e., the English-speaking populations in Quebec and the French-speaking populations in the other provinces.
This article uses data from the Census of Population to shed light on the key trends in internal migration in Canada, particularly the migration of minority language populations. The article examines internal migration flows (in other words, people who moved to a different place within Canada) between two censuses as well as the cumulative effects of these migrations in the longer term, by looking at the province of birth of French and English speakers. In this article, the language groups are defined by the first official language spoken (see “Definitions, concepts and geography”).
According to 2021 Census data on mobility by language group, some historical trends persist, such as the high number of Quebec-born individuals living in French-speaking communities in most of the other provinces. However, the data also show that some trends have reversed. For example, from 2016 to 2021, net interprovincial migration in Alberta was negative (more out-migrants than in-migrants), something that has not been seen in the province since the period from 1986 to 1991. By contrast, net interprovincial migration of French speakers in New Brunswick was positive (more in-migrants than out-migrants), as a result of people born in the province moving back. Finally, net interprovincial migration of English speakers in Quebec was slightly negative, which contrasts with the strong negative balances in the province of previous decades. The reversal in these trends may be linked to disruptions stemming from the COVID-19 pandemic, but could also reflect certain longer-term social and economic changes.
Approximately 810,000 English speakers and 80,000 French speakers moved to a different province between 2016 and 2021
In 2021, nearly 1 million people (921,000) across Canada were not living in the same province or territory as five years earlier. This is higher than the number observed in each of the five previous intercensal periods, but lower than the number of interprovincial migrants in the 1986-to-1991 period. However, the interprovincial migration rate, or the proportion of people who moved to a different province between two censuses, was lower for the 2016-to-2021 period than for each intercensal period since the 1970s, except the period from 2011 to 2016. In fact, the interprovincial migration rates of both English and French speakers have generally been trending downward in the last few decades.
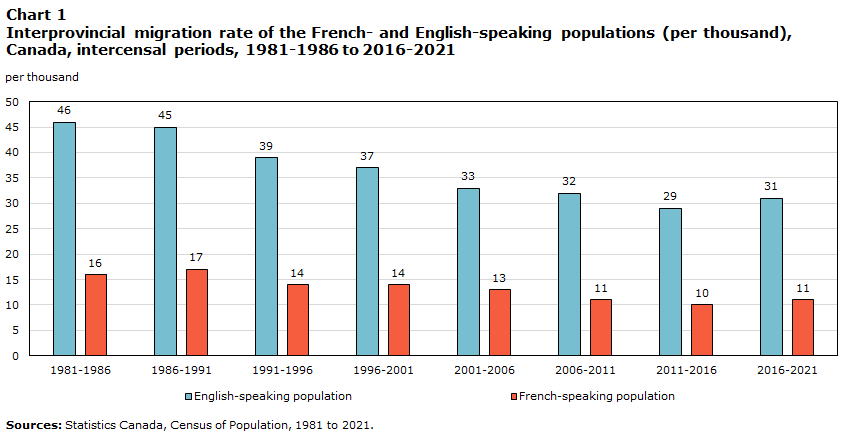
For the 2016-to-2021 intercensal period, the interprovincial migration rate was 31‰ among English speakers and 11‰ among French speakers. For multiple census cycles, the gap between the English and French populations for interprovincial mobility has been similar, changing very little over time.
Data table for Chart 1
| English-speaking population | French-speaking population | |
|---|---|---|
| per thousand | ||
| 1981-1986 | 46 | 16 |
| 1986-1991 | 45 | 17 |
| 1991-1996 | 39 | 14 |
| 1996-2001 | 37 | 14 |
| 2001-2006 | 33 | 13 |
| 2006-2011 | 32 | 11 |
| 2011-2016 | 29 | 10 |
| 2016-2021 | 31 | 11 |
| Sources: Statistics Canada, Census of Population, 1981 to 2021. | ||
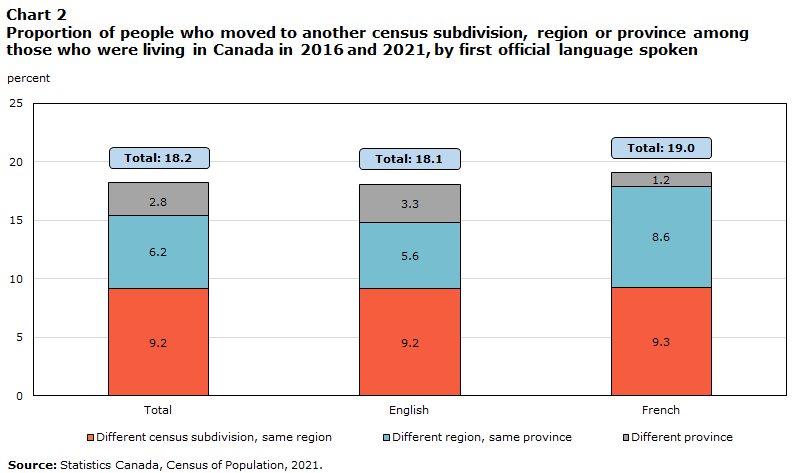
Internal mobility is not limited to migration between provinces and territories. Many people move to a different city or region within the same province (in this article, a region refers to an economic region. See “Definitions, concepts and geography.”). In 2021, while French speakers were much less likely than English speakers to have moved to a different province since 2016 (1.2% and 3.3%, respectively),Note 2 they were more likely to move to a different region within the same province (8.6% and 5.6%, respectively). Overall, French speakers were slightly more likely than English speakers to move to a different census subdivision (19.0% versus 18.1%) (a census subdivision generally corresponds to a municipality).
Data table for Chart 2
| Total | English | French | |
|---|---|---|---|
| percent | |||
| Different census subdivision, same region | 9.2 | 9.2 | 9.3 |
| Different region, same province | 6.2 | 5.6 | 8.6 |
| Different province | 2.8 | 3.3 | 1.2 |
| Total | 18.2 | 18.1 | 19.0 |
| Source: Statistics Canada, Census of Population, 2021. | |||
Employment and family-related reasons are the primary reasons reported for moving to a different province
According to data from the 2021 Canadian Housing Survey, the main reasons reported by respondents who had recently moved to a different province generally did not vary much by language profile, place of origin, or place of residence after the move. Among those who moved to Ontario or Quebec between 2016 and 2021, employment was the most common reason for the move. In addition, both French and English speakers who moved to New Brunswick often cited family reasons for their move, as did English speakers, particularly those who moved to British Columbia.
Less than a third of French speakers living in Newfoundland and Labrador, Alberta, British Columbia and the territories were born there
In 2021, 7.7 million French speakers were living in Canada. The vast majority (83.2%) were born in the province where they lived and 11.9% were born in another country. Around 375,000 people, or 4.9% of Canada’s French-speaking population, were born in a different province than the one they were living in at the time of the census. This compares with 12.3% of English speakers.
In Quebec, where 88.2% of the country’s French-speaking population were living in 2021, 144,000 French speakers (2.1% of the province’s French-speaking population) were born in another province, two thirds of them in Ontario. Similarly, 170,000 French speakers who were born in Quebec were living in another province, mostly in Ontario, including 47,000 in the Ottawa region.
In many provinces, most French speakers were born and were living in that province. However, this was not true for the three territories, British Columbia, Newfoundland and Labrador and Alberta. For each of these provinces and territories, more French speakers had been born in Quebec than in their province of residence.
In eight provinces and the three territories, at least one in eight French speakers were born in Quebec. The exceptions were New Brunswick and Manitoba, where around 1 in 15 French speakers were born in Quebec. Moreover, 1 in 10 French speakers in Nova Scotia and Prince Edward Island were born in New Brunswick. Similarly, 1 in 10 French speakers in British Columbia were born in Ontario (the same proportion as French speakers who were born in British Columbia).
| Province or territory of residence | Born in their province or territory of residence | Born in Quebec | Born in another province or territory | Born abroad |
|---|---|---|---|---|
| percent | ||||
| New Brunswick | 86.8 | 6.7 | 2.9 | 3.6 |
| Quebec | 86.2 | 86.2 | 2.1 | 11.7 |
| Manitoba | 74.4 | 6.9 | 6.9 | 11.8 |
| Ontario | 58.7 | 21.2 | 3.9 | 16.2 |
| Nova Scotia | 57.1 | 18.9 | 17.8 | 6.3 |
| Prince Edward Island | 56.7 | 13.9 | 20.7 | 8.8 |
| Saskatchewan | 54.7 | 14.9 | 15.6 | 14.9 |
| Alberta | 25.4 | 30.2 | 22.0 | 22.5 |
| Newfoundland and Labrador | 19.8 | 36.9 | 20.5 | 22.8 |
| Northwest Territories | 18.5 | 43.9 | 27.4 | 10.2 |
| Yukon | 12.6 | 49.6 | 20.8 | 17.0 |
| Nunavut | 12.0 | 49.6 | 23.0 | 15.5 |
| British Columbia | 9.9 | 40.2 | 23.4 | 26.6 |
| Canada | 83.2 | 78.2 | 4.9 | 11.9 |
| Source: Statistics Canada, Census of Population, 2021. | ||||
Half of French speakers born in Saskatchewan and British Columbia and most of those born in Newfoundland and Labrador no longer live in their province of birth
In 2021, while French speakers generally lived in the same province where they were born, about half of French speakers born in Saskatchewan (49.7%) or British Columbia (48.7%) and more than four-fifths (83.0%) of those born in Newfoundland and Labrador did not. Among French speakers who no longer lived in their province of birth, Quebec was generally the most common province of residence in 2021. For example, a quarter (96,000 people) of Ontario-born French speakers were living in Quebec in 2021, 48,000 of whom lived in the Outaouais region.
The return of French-speaking New Brunswickers to their province of birth contributes to positive net interprovincial migration
From 2016 to 2021, the total population of New Brunswick rose 3.9%, after dipping slightly in the previous five-year period. However, while the English-speaking population increased, the French-speaking population continued to decline, reaching its lowest level since 1981.
Migration across Canada has changed recently, likely due to the COVID-19 pandemic and adaptations in the labour market.Note 3 These changes favoured migration flows toward rural areas at the expense of large urban centres. For example, from 2016 to 2021, more people left other provinces to move to New Brunswick than vice versa. This is a reversal in trend for the province, where net interprovincial migration has been negative for most of the recent intercensal periods, for both French speakers and the rest of the population.
In fact, between 2016 and 2021, the number of French speakers who left New Brunswick to settle in another province (6,300 people) was at its lowest level in over 40 years, while the reverse flow—moving to New Brunswick (7,800 people)—was at its highest level since the 1981-to-1986 intercensal period.
Many of the people who moved to New Brunswick were returning. Almost one in two French-speaking interprovincial migrants (46.6%; 3,700 people) who moved to New Brunswick between 2016 and 2021 were born in the province. Most of these returning New Brunswickers had previously been living in Quebec (1,400 people), Ontario (900 people) or Alberta (600 people) and accounted for a high proportion of the migration from these provinces to New Brunswick.
Net interprovincial migration of English speakers in Quebec practically nil after decades in the negative
For decades, net interprovincial migration in Quebec has regularly been negative, for both French and English speakers. However, from 2016 to 2021, net interprovincial migration of French speakers was practically nil (almost as many in-migrants as out-migrants), while it was slightly negative for English speakers. The number of people moving to Quebec (84,000 people) from elsewhere in Canada was at its highest level in more than 40 years, while the number of people leaving the province (90,000 people), although relatively similar to the figure from the 2011-to-2016 period, was well below the number observed in the last decades of the 20th century.
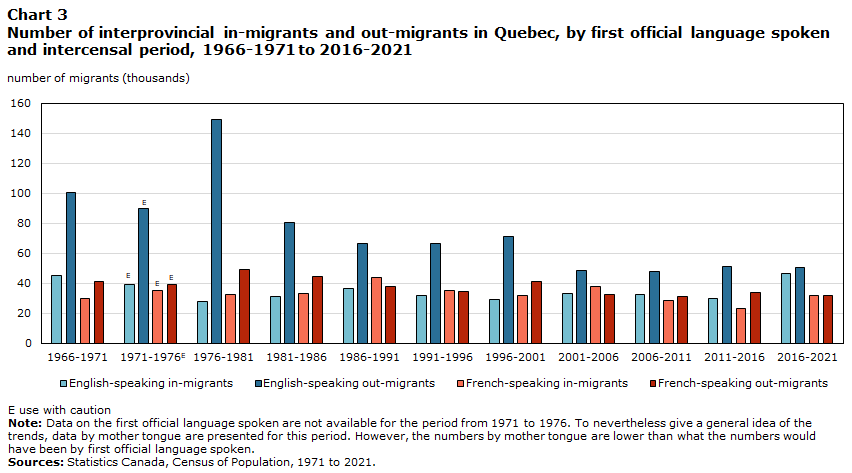
This trend reversal primarily reflects the changes observed among English speakers. Though the number of English speakers who left Quebec was high before the 2000s—and especially during the 1960s and 1970s—it has held steady at a lower level for about 20 years (around 50,000 out-migrants per intercensal period). More recently, from 2016 to 2021, it was mostly the number of English speakers moving to Quebec that increased, and was almost on par with the number of people moving out of the province. As a result, for the first time in at least 50 years, interprovincial migration flows barely contributed to a decline in Quebec’s English-speaking population. This coincided with historically low unemployment rates in the province.
Data table for Chart 3
| English-speaking in-migrants | English-speaking out-migrants | French-speaking in-migrants | French-speaking out-migrants | |
|---|---|---|---|---|
| number of migrants (thousands) | ||||
| 1966-1971 | 45.0 | 100.2 | 29.8 | 40.9 |
| 1971-1976Note E: Use with caution | 39.5Note E: Use with caution | 89.6Note E: Use with caution | 35.2Note E: Use with caution | 39.1Note E: Use with caution |
| 1976-1981 | 27.7 | 149.3 | 32.2 | 49.1 |
| 1981-1986 | 31.4 | 80.7 | 32.9 | 44.7 |
| 1986-1991 | 36.4 | 66.7 | 43.6 | 37.8 |
| 1991-1996 | 31.7 | 66.4 | 35.4 | 34.3 |
| 1996-2001 | 29.0 | 71.3 | 31.6 | 40.9 |
| 2001-2006 | 33.1 | 48.6 | 37.6 | 32.2 |
| 2006-2011 | 32.3 | 47.7 | 28.6 | 31.2 |
| 2011-2016 | 29.8 | 51.1 | 23.1 | 33.7 |
| 2016-2021 | 46.8 | 50.7 | 32.0 | 31.9 |
|
E use with caution Note: Data on the first official language spoken are not available for the period from 1971 to 1976. To nevertheless give a general idea of the trends, data by mother tongue are presented for this period. However, the numbers by mother tongue are lower than what the numbers would have been by first official language spoken. Sources: Statistics Canada, Census of Population, 1971 to 2021. |
||||
More Quebec-born English speakers live in Toronto or Ottawa than in Laval or the Outaouais region
Approximately 1.1 million English speakers were living in Quebec in 2021. More specifically, just over half (52.8%; 570,000 people) were born in Quebec, 36.0% (or 388,000 people) were born outside Canada, and 11.2% (121,000 people) were born in another province. Of those born in another province, 78,000 were born in the neighbouring province of Ontario, 30,000 of whom lived in the Outaouais region.
At the same time, in keeping with long-standing migration trends that continued between 2016 and 2021, 337,000 Quebec-born English speakers were living in another province. Of these, 215,000 lived in Ontario, including 80,000 in the Toronto region and 60,000 in the Ottawa region. By comparison, 51,000 English speakers born in Quebec lived in Laval, and a smaller number lived in each of Quebec’s other regions, except Montréal (289,000 people) and Montérégie (108,000 people).
Montréal saw more English and French speakers leave than move to the city
Montréal Island is the main place of residence for English speakers in Quebec. However, from 2016 to 2021, net interregional migration of English speakers in Montréal was negative (-27,000 people), with more people having left the region for another than vice versa. The negative balance was especially high with the neighbouring region of Montérégie (-12,000 people). Montréal Island also had negative net migration balances with other neighbouring regions (Laval, Lanaudière and the Laurentides) and with the Ottawa and Toronto regions. However, the departure of these English speakers from Montréal Island to other regions in Quebec was largely offset by the arrival of people from outside Canada (+74,000 English speakers between 2016 and 2021).
Net interregional migration of French speakers on Montréal Island was also negative (-93,000 people), but was also offset by the arrival of French speakers from outside Canada (+90,000). This negative balance is primarily due to moves to neighbouring regions, often to suburbs (total net migration of -82,000 in favour of Montérégie, Lanaudière, Laval and the Laurentides), but also to other regions of Quebec (such as Estrie, Mauricie, Outaouais and Bas-St-Laurent).
Moves from Montréal Island to the suburbs are not new; they were observed in the past few intercensal periods among both English and French speakers. Moreover, migration flows from central neighbourhoods to suburbs are not specific to the Montréal area—they are observed in most large Canadian cities.
Interprovincial migration does not contribute to a decline in Ontario’s French-speaking population
In Ontario, while the total population increased 6.0% from 2016 to 2021, the province’s French-speaking population fell 4.7% to 478,000. Interprovincial migration did not contribute to this decline; net interprovincial migration of French speakers was virtually nil, while total net interprovincial migration for the province was slightly negative.
Since 1976, French speakers have generally left Ontario for Alberta and, to a lesser extent, British Columbia. However, it seems to have changed between 2016 and 2021. Even though net interprovincial migration of French speakers with British Columbia is negative, net interprovincial migration with Alberta favours Ontario.
Nevertheless, in the past four decades, migration of French speakers from Ontario has mostly taken place with the neighbouring province of Quebec.
Ontario–Quebec: the highest migration exchange in 20 years and virtually nil net migration
Interprovincial migration flows between Quebec and Ontario, which totalled over 108,000 migrants for the 2016-to-2021 period, rank second in Canada, behind the flows between Alberta and British Columbia. Moreover, it is by far the highest level observed for French speakers (35,000 migrants).
Ontario is the main destination of French- and English-speaking interprovincial migrants from Quebec, while Quebec is both the main point of departure and the main destination of French-speaking interprovincial migrants from Ontario. However, English speakers tend to move to Alberta or British Columbia more often and also move from these two provinces to Ontario.
For decades, Quebec has had a strong negative net interprovincial migration rate with Ontario for English speakers. However, this rate decreased for the period between 2016 and 2021, primarily due to a higher number of English speakers who moved from Ontario to Quebec compared with recent intercensal periods. Of the 30,000 English speakers who moved from Ontario to Quebec between 2016 and 2021, 11,000 (38%) had been living in the Toronto region and 11,000 (36%) in the Ottawa region and eastern Ontario.
Between 2016 and 2021, about the same number of French speakers moved from Ontario to Quebec as from Quebec to Ontario. In recent decades, though, net migration of the French-speaking population has alternated, positive at times in Ontario and at other times in Quebec.
Most French speakers who move from Quebec to Ontario or vice versa were born in Quebec. For example, more than half of French speakers who left Ontario, where they were living in 2016, to move to Quebec between 2016 and 2021, were returning to their province of birth. However, the situation was different for English-speaking migrants: 45% of English speakers who moved from Quebec to Ontario were born abroad, while about a quarter were born in Ontario.
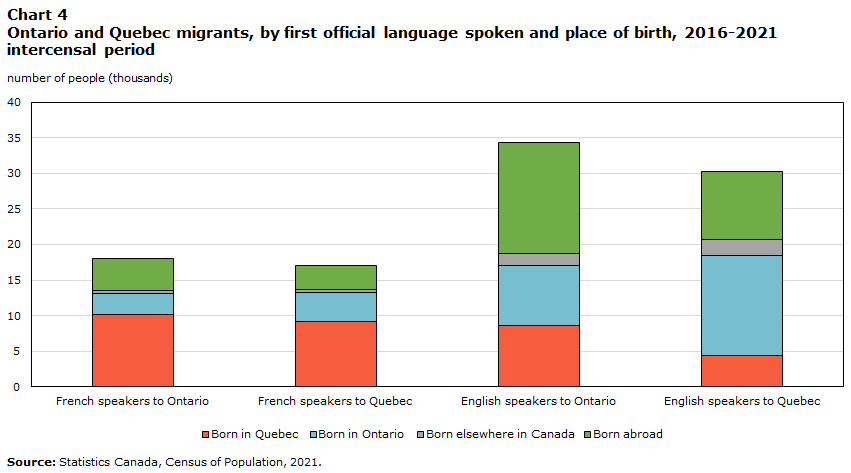
Data table for Chart 4
| Born in Quebec | Born in Ontario | Born elsewhere in Canada | Born abroad | |
|---|---|---|---|---|
| number of people (thousands) | ||||
| French speakers to Ontario | 10.1 | 3.0 | 0.5 | 4.5 |
| French speakers to Quebec | 9.2 | 4.0 | 0.5 | 3.4 |
| English speakers to Ontario | 8.6 | 8.4 | 1.8 | 15.6 |
| English speakers to Quebec | 4.4 | 14.1 | 2.2 | 9.5 |
| Source: Statistics Canada, Census of Population, 2021. | ||||
The Ottawa region attracts French speakers from all over Canada
Of all French speakers living in Ontario, most were in the Ottawa region, including eastern Ontario (46.4% of all the French speakers in Ontario), in northeastern Ontario (21.3%)—where Greater Sudbury is the largest centre—and in the Toronto region (15.2%). From 2016 to 2021, the French-speaking population in the Ottawa region remained stable, but it decreased in the other two regions. Positive net migration of French speakers contributed to holding the French-speaking population of the Ottawa region steady.
The Ottawa region attracts French speakers from across Canada. Between 2016 and 2021, close to 18,000 French speakers left another region in Canada to move to the Ottawa region. This is the highest total for a region of destination outside Quebec. In fact, the Ottawa region was the primary destination in Canada for French speakers who left Manitoba or Alberta between 2016 and 2021, as well as many French speakers (5,000 people) who were previously living in another region of Ontario.
Furthermore, over 21,000 people moved from Ottawa to Quebec’s Outaouais region or vice versa between 2016 and 2021, resulting in a slightly positive migration rate for English speakers in Outaouais and net migration of practically nil for French speakers.
Negative net interprovincial migration in Alberta for French speakers coincides with a strong labour market in Quebec
For the first time since the 1986-to-1991 intercensal period, Alberta’s net interprovincial migration was negative (more out-migrants to the rest of Canada than in-migrants) during the period from 2016 to 2021 among both English and French speakers. The period of positive net migration of French speakers coincided with a lower unemployment rate in Alberta than in Quebec, the main province of origin of the French speakers who were living in Alberta. Starting in 2016, the trend in unemployment rates inverted, which leads us to believe that the labour market being more favourable in Alberta than in Quebec diminished.
The number of French speakers who moved to Alberta fell sharply from 10,700 in the 2011-to-2016 period to 5,900 for the period from 2016 to 2021, while the number of French speakers who moved from Alberta to another province rose from 6,300 to 9,400. Of the French speakers who left Alberta between 2016 and 2021, roughly half (4,600 people) moved back to their province of birth, which in 70% of cases was Quebec. This trend in return migration to the province of birth was also observed among English speakers, primarily the ones who moved back to British Columbia or Ontario. By comparison, fewer English speakers and practically no French speakers who were born in Alberta moved back to their province of birth during this intercensal period.
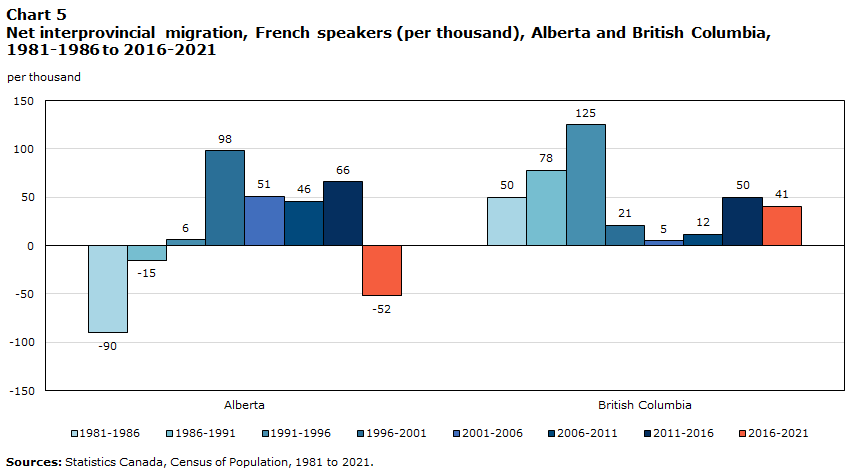
Data table for Chart 5
| Alberta | British Columbia | |
|---|---|---|
| per thousand | ||
| 1981-1986 | -90 | 50 |
| 1986-1991 | -15 | 78 |
| 1991-1996 | 6 | 125 |
| 1996-2001 | 98 | 21 |
| 2001-2006 | 51 | 5 |
| 2006-2011 | 46 | 12 |
| 2011-2016 | 66 | 50 |
| 2016-2021 | -52 | 41 |
| Sources: Statistics Canada, Census of Population, 1981 to 2021. | ||
Migration of the French-speaking population to British Columbia increases between 2016 and 2021
In 2021, the number of Canadians outside Quebec with French as their first official language spoken was down from 2016 in all the provinces, except British Columbia. The unique situation in British Columbia is due to positive net interprovincial migration of French speakers between 2016 and 2021 (+2,200).
In fact, net migration of French speakers in British Columbia has been positive for each intercensal period since the 1966-to-1971 period. Most French speakers who settled in British Columbia came from Quebec, but also from Ontario and Alberta. Between 2016 and 2021, the number of French-speaking interprovincial migrants (7,700 people) who moved to British Columbia rose 9.7% from the previous period between censuses, driven by an increase in migration from Quebec and Ontario.
Meanwhile, 5,400 French speakers moved from British Columbia to another province between 2016 and 2021. Of the 3,200 French speakers who moved from British Columbia to Quebec, just over three-quarters (76%) were actually born in Quebec.
Definitions, concepts and geography
The reference population of this article comprises respondents to the Census of Population long-form questionnaire, i.e., people who live in private households in Canada.
In this article, French speakers and English speakers refer to people whose first official language spoken, respectively, is French only or English only. These two categories include a) people who know only one of these two languages, b) people bilingual in English and French, but who have only one of these two languages as their mother tongue, and c) bilingual people who have neither of these two languages as their mother tongue, but who speak one of these two languages most often at home. Other people are classified in the categories “English and French” and “Neither English nor French,” which are not explored in this article. A detailed explanation of this concept can be found in the standard First official language spoken of person.
Since some language characteristics that go into deriving the first official language spoken can change over a person’s lifetime, it is possible for a person to change categories over time. In principle, this could impact migration results by language group, since the migration itself could affect language behaviours. However, the effect this could have on the trends described in this article can only be limited.
In this paper, a migrant is a person who reported a different place of residence five years earlier than their current place of residence. While people may have moved more than once during this five-year period, only the places indicated in these two census reference points are considered. Only people who were living in Canada at these two points in time can be considered internal migrants; people who were living outside Canada five years before a census are external migrants. Lastly, people who were not born five years before the census cannot be considered migrants, according to the concepts used here.
The interprovincial migration rate is calculated by dividing the number of residents of a province who were living in another province or territory in the previous period by the average total population of the province (or territory) of residence in the current period and the previous period. This rate is often expressed as per thousand persons (‰).
An intercensal period refers to the five-year period between two censuses.
All the results presented in this article are based on the 2021 geographical boundaries. The term region refers to an economic region. For more information, please consult the Dictionary, Census of Population, 2021 – Economic region (ER).
Acknowledgements
This report was prepared by Bertrand Ouellet-Léveillé, Gabriel St-Amant and Louis Cornelissen of Statistics Canada’s Centre for Demography, with the assistance of other staff members of this Centre and the collaboration of staff from the Census Subject Matter Secretariat, the Census Operations Division, the Communications Branch, and the Data Access and Dissemination Branch.
- Date modified: