
Census in Brief
Are young bachelor's degree holders finding jobs that match their studies?
Release date: November 29, 2017
Highlights
- Young graduates with bachelor's degrees in the fields of study of 'nursing,' 'engineering,' 'education and teaching' and 'computer and information science' are more likely than other graduates to find work closely related to their studies.
- Given Canada's aging population, individuals with health care skills are increasingly important to the labour market. Women comprise the majority in health fields, including 'nursing,' 'medicine,' and 'health diagnostic and treatment related professions' (such as mammography and MRI technicians). Most women with degrees or diplomas in these fields find work that matches their studies.
- Young bachelor's degree holders in 'engineering' and 'computer and information science' were very likely to bring their qualifications to where they were needed in the labour market, as 7 in 10 worked in science and technology occupations. By contrast, young graduates in 'biological sciences' tended to work in fields other than science and technology.
- Young bachelor's degree holders in 'arts and humanities' and 'social and behavioural sciences' were more likely than other young graduates with bachelor's degrees to work in jobs typically requiring a high school education at most. Bachelor's degree holders working in such jobs are classified as being 'overqualified.'
Introduction
Are young postsecondary graduates finding employment related to their studies?Note 1 Are there opportunities for them to use the skills they have acquired by obtaining bachelor's degrees? Do women and men fare similarly? And are there differences on these dimensions whether they are 'science, technology, engineering and mathematics' (STEM) graduates or 'business, humanities, health, arts, social science and education' (BHASE) graduates?Note 2 Young people and their parents often have such questions in mind when choosing education programs.
This document, on the match between what Canadians study and their occupation after graduation, complements another 2016 Census in Brief article, Is field of study a factor in the earnings of young bachelor's degree holders?, which looks at the earnings of young graduates in STEM and BHASE fields of study.
To ensure a prosperous future, Canada requires graduates who are prepared to build and maintain a strong social infrastructure in areas such as education, communications, justice and health. Canada also needs graduates who have the scientific and technical skills to move into jobs that will advance the country's scientific and business innovation agenda.
'Engineering' and 'computer and information science' graduates most likely to work in science and technology occupations
The skills of young graduates in STEM fields help expand the frontiers of science and technology. This is critical to ensuring Canada's competitiveness in the global economy. Overall, half of young employed STEM graduates with a bachelor's degree worked in science and technology occupations.Note 3 Young STEM graduates in 'engineering' and in 'computer and information science' were the most likely to bring their education‑related skills to this labour market sector; i.e., more than 7 in 10 of those employed were working in science and technology occupations.Note 4
Not all STEM graduates are moving into science and technology occupations. Whether employed graduates were more likely or less likely to be found working in science and technology jobs depended on the type of engineering degree they had. About 85% of young 'surveying engineering' and 'geological engineering' graduates worked in science and technology occupations, while 71.5% of 'mechanical engineering' graduates and 48.6% of 'construction engineering' graduates did so.Note 5 STEM graduates of the 'biological sciences' tended to work outside the science and technology field. For example, only 13.4% of young women with a bachelor's degree in 'biological sciences' who were employed worked in science and technology occupations, whereas 26.2% of this group worked in health occupations (Table 2).
Young men with a STEM degree twice as likely as young women to work in science and technology occupations
Among young people who graduated with a bachelor's degree from a STEM program, men were almost twice as likely as women to be working in science and technology occupations (Tables 1 and 2). This is partly because these men and women studied different disciplines within STEM. For example, women were less likely than men to have obtained bachelor's degrees in 'engineering' or in 'computer and information science,' but were more likely than men to have bachelor's degrees in 'biological sciences,' where graduates, whether men or women, were less likely to work in science and technology occupations.
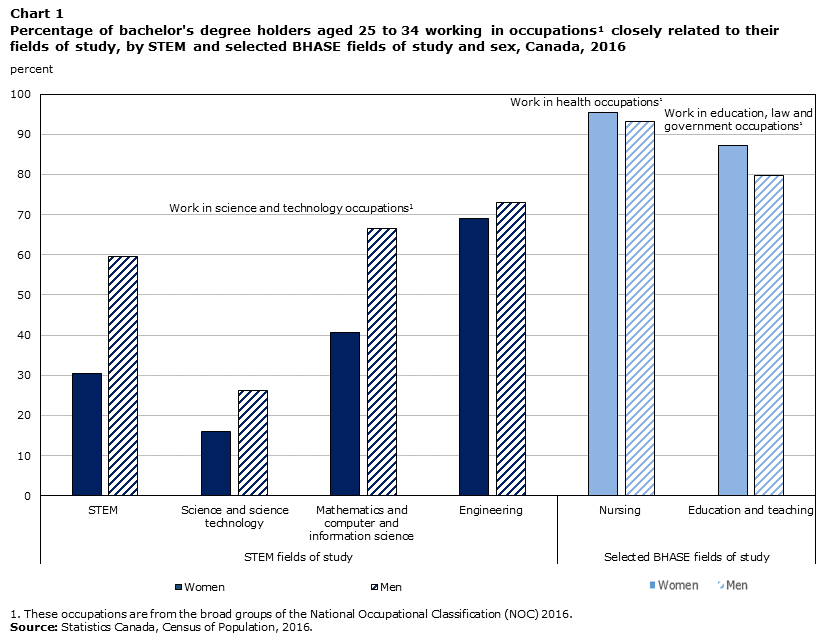
Data table for Chart 1
| Women | Men | ||
|---|---|---|---|
| percent | |||
| STEM fields of study | STEM | 30.5 | 59.6 |
| Science and science technology | 16.1 | 26.3 | |
| Mathematics and computer and information science | 40.6 | 66.5 | |
| Engineering | 69.1 | 73.0 | |
| Selected BHASE fields of study | Nursing | 95.4 | 93.1 |
| Education and teaching | 87.3 | 79.8 | |
|
|||
Women are the majority in health fields and finding work that matches their studies
More than 9 in 10 young graduates with a bachelor's degree in 'nursing' (92.7%) were women.Note 6 The work these women found matched their studies: almost all young women with a 'nursing' degree (95.4%) who were employed worked in health occupations (Table 1). This is partly a reflection of the strong demand for skills in health care fields in an aging society. Women accounted for the majority in health fields at the college‑ and medical‑degree levels as well, and the work these women found also matched their studies. For example, about 65% of young college graduates in fields related to health diagnostic and treatment technologiesNote 7 were women. As well, 85.1% of employed women with a college diploma in these fields worked in health occupations. Similarly, women accounted for more than 6 in 10 young graduates with medical degrees; i.e., degrees in medicine, dentistry, veterinary medicine and optometry. Furthermore, almost all young employed women with medical degrees (96.4%) worked in health occupations.Note 8
'Education and teaching' graduates very likely to be in occupations closely related to their studies
Women also comprised the majority in the 'education and teaching' field. Among young graduates who obtained bachelor's degrees in this field, the majority (81.2%) were women.Note 9 These women were very likely to be in occupations closely related to their studies: almost 8 in 10 of those who were employed were working as elementary or secondary school teachers.Note 10 Similarly, about three‑quarters of employed young men with a degree in 'education and teaching' were elementary or secondary school teachers.Note 11
Young graduates in 'nursing,' 'engineering,' 'education and teaching' and 'computer and information science' less likely to be overqualified in their jobs
Charts 2 and 3 present the overqualification rates for young women and men who graduated with a bachelor's degree in different fields of study. For bachelor's degree holders, being "overqualified" means working in an occupation that typically requires a high school education at most. For both young women and men, those who graduated with a bachelor's degree in the 'nursing' field of study had the lowest overqualification rates, followed by those from 'engineering.' Apart from 'nursing' and 'engineering,' graduates from 'education and teaching' and from 'computer and information science' also had lower overqualification rates than the remaining fields of study. As discussed previously, graduates from these four fields were very likely to work in occupations that match their studies, hence their lower overqualification rates as the occupations they are moving into typically require a high level of education. One reason why graduates from these fields of study were very likely to work in occupations that match their studies is the close association between these educational programs and specific job requirements.
At the other end of the spectrum, both young women and men who graduated with a bachelor's degree in 'humanities' had the highest overqualification rate. Apart from 'humanities,' graduates from the fields of study of 'arts' and 'social and behavioural sciences' also had higher overqualification rates than the remaining fields. The critical thinking, analytical and writing skills that graduates of 'arts and humanities' and 'social and behavioural sciences' may possess can be applied in many different occupations. While the occupational options may be broader for these graduates, the overqualification rates were also higher for them as some may work in occupations not typically requiring a postsecondary education.

Data table for Chart 2
| Women | |
|---|---|
| percent | |
| Nursing | 1.9 |
| Engineering | 5.6 |
| Education and teaching | 6.2 |
| Computer and information science | 8.2 |
| Mathematics and related studies | 15.2 |
| Physical and chemical sciences | 17.8 |
| Biological sciences | 18.8 |
| Business and administration | 19.9 |
| General and integrated sciences | 21.0 |
| Social and behavioural sciences | 24.6 |
| Arts | 26.3 |
| Humanities | 28.8 |
|
|
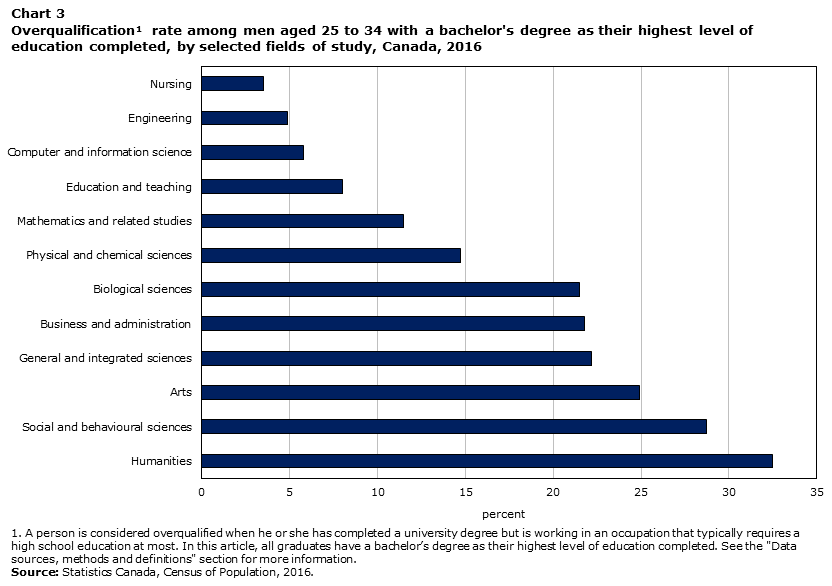
Data table for Chart 3
| Men | |
|---|---|
| percent | |
| Nursing | 3.5 |
| Engineering | 4.9 |
| Computer and information science | 5.8 |
| Education and teaching | 8.0 |
| Mathematics and related studies | 11.5 |
| Physical and chemical sciences | 14.7 |
| Biological sciences | 21.5 |
| Business and administration | 21.8 |
| General and integrated sciences | 22.2 |
| Arts | 24.9 |
| Social and behavioural sciences | 28.7 |
| Humanities | 32.5 |
|
|
Young 'engineering' graduates in Newfoundland and Labrador very likely to work in science and technology occupations
One of the challenges in a large country like Canada is bringing the talent to the jobs. Among the provinces, Newfoundland and Labrador had the highest proportion of employed 'engineering' graduates working in science and technology occupations (82.0%). This reflects in part the strong demand for such graduates in the province's oil sector. In contrast, 'engineering' graduates who were employed in Nova Scotia were least likely (63.1%) to work in science and technology occupations. Overall, young employed STEM graduates in Nova Scotia were less likely than those in all other provinces to work in science and technology occupations.
Of all provinces, Quebec had the highest percentage (63.2%) of employed STEM graduates working in science and technology occupations, followed by Newfoundland and Labrador (57.7%) and Alberta (55.7%). Compared with all other provinces, these three provinces had a higher proportion of STEM graduates from ‘engineering.’ As discussed previously, ‘engineering’ graduates were very likely to work in science and technology occupations. Other factors such as the high demand for STEM graduates in the resources sector in Alberta and Newfoundland and Labrador and in the aerospace and high tech sectors in Quebec likely also contributed to STEM graduates in these regions finding work related to their fields of study.
| Field of study | Management occupations | Business, finance and administration occupations | Natural and applied sciences and related occupations | Health occupations | Occupations in education, law and social, community and government services | Occupations in art, culture, recreation and sport | Sales and service occupations | Other occupations | Total |
|---|---|---|---|---|---|---|---|---|---|
| percent | |||||||||
| All fields of study | 9.5 | 24.2 | 6.2 | 15.0 | 27.5 | 5.3 | 11.2 | 1.3 | 100 |
| STEM | 9.0 | 15.6 | 30.5 | 15.2 | 13.4 | 3.4 | 9.9 | 3.1 | 100 |
| Science and science technology | 8.3 | 17.0 | 16.1 | 22.9 | 16.7 | 3.6 | 12.1 | 3.2 | 100 |
| Physical and chemical sciences | 7.4 | 13.4 | 40.8 | 7.1 | 14.0 | 2.6 | 10.9 | 4.1 | 100 |
| Biological sciences | 8.6 | 16.5 | 13.4 | 26.2 | 16.1 | 4.3 | 11.9 | 3.0 | 100 |
| General and integrated sciences | 7.7 | 19.7 | 14.0 | 19.8 | 19.7 | 2.3 | 13.5 | 3.5 | 100 |
| Engineering and engineering technology | 10.5 | 6.7 | 69.1 | 0.5 | 3.6 | 1.3 | 4.0 | 4.0 | 100 |
| Engineering | 10.6 | 6.7 | 69.2 | 0.5 | 3.6 | 1.4 | 4.0 | 4.0 | 100 |
| Mathematics and computer and information science | 9.7 | 22.5 | 40.6 | 0.7 | 12.0 | 5.6 | 8.0 | 0.9 | 100 |
| Mathematics and related studies | 10.2 | 29.7 | 29.1 | 1.0 | 18.1 | 0.5 | 10.7 | 0.7 | 100 |
| Computer and information science | 9.1 | 13.9 | 54.0 | 0.4 | 4.8 | 11.9 | 4.8 | 1.0 | 100 |
| BHASE (non‑STEM) | 9.5 | 25.5 | 2.4 | 15.0 | 29.6 | 5.6 | 11.3 | 1.0 | 100 |
| Business and administration | 18.8 | 55.2 | 2.4 | 0.4 | 6.9 | 1.6 | 14.0 | 0.7 | 100 |
| Arts and humanities | 10.8 | 25.3 | 3.0 | 2.1 | 18.5 | 19.5 | 18.9 | 1.9 | 100 |
| Arts | 10.1 | 16.5 | 4.3 | 1.5 | 10.1 | 35.0 | 19.8 | 2.8 | 100 |
| Humanities | 11.3 | 30.4 | 2.2 | 2.6 | 23.4 | 10.4 | 18.4 | 1.4 | 100 |
| Social and behavioural sciences | 11.7 | 32.7 | 2.7 | 4.4 | 26.5 | 5.6 | 15.3 | 1.2 | 100 |
| Health care | 1.6 | 2.3 | 1.0 | 88.7 | 3.6 | 0.5 | 2.1 | 0.2 | 100 |
| Nursing | 0.9 | 0.7 | 0.1 | 95.4 | 1.7 | 0.2 | 0.9 | 0.1 | 100 |
| Health care, n.e.c. | 4.3 | 9.5 | 4.7 | 60.1 | 11.8 | 1.9 | 7.2 | 0.6 | 100 |
| Education and teaching | 1.9 | 4.6 | 0.3 | 0.4 | 87.3 | 1.3 | 3.7 | 0.4 | 100 |
| Trades, services, natural resources and conservationTable 1 Note 2 | 7.5 | 13.0 | 9.9 | 2.8 | 51.4 | 4.7 | 8.9 | 1.8 | 100 |
|
|||||||||
| Field of study | Management occupations | Business, finance and administration occupations | Natural and applied sciences and related occupations | Health occupations | Occupations in education, law and social, community and government services | Occupations in art, culture, recreation and sport | Sales and service occupations | Other occupations | Total |
|---|---|---|---|---|---|---|---|---|---|
| percent | |||||||||
| All fields of study | 15.2 | 19.5 | 25.6 | 2.7 | 12.9 | 4.8 | 13.1 | 6.2 | 100 |
| STEM | 11.3 | 6.6 | 59.6 | 2.7 | 5.4 | 2.2 | 6.2 | 6.0 | 100 |
| Science and science technology | 11.8 | 10.9 | 26.3 | 10.2 | 13.2 | 4.4 | 12.2 | 11.1 | 100 |
| Physical and chemical sciences | 11.4 | 7.4 | 50.6 | 2.0 | 7.9 | 1.6 | 8.7 | 10.4 | 100 |
| Biological sciences | 12.2 | 10.9 | 16.4 | 14.5 | 15.7 | 6.1 | 13.0 | 11.1 | 100 |
| General and integrated sciences | 11.3 | 14.3 | 26.0 | 7.5 | 12.2 | 3.1 | 13.8 | 11.6 | 100 |
| Engineering and engineering technology | 12.1 | 3.6 | 73.0 | 0.2 | 2.0 | 0.6 | 3.6 | 5.0 | 100 |
| Engineering | 12.1 | 3.6 | 73.0 | 0.1 | 2.1 | 0.6 | 3.6 | 5.0 | 100 |
| Mathematics and computer and information science | 8.8 | 8.6 | 66.5 | 0.3 | 4.4 | 3.3 | 5.5 | 2.6 | 100 |
| Mathematics and related studies | 10.5 | 19.6 | 42.5 | 0.5 | 12.7 | 1.0 | 9.1 | 3.9 | 100 |
| Computer and information science | 8.4 | 5.3 | 73.7 | 0.2 | 1.9 | 4.0 | 4.4 | 2.2 | 100 |
| BHASE (non‑STEM) | 17.3 | 26.6 | 7.0 | 2.8 | 17.0 | 6.1 | 16.8 | 6.4 | 100 |
| Business and administration | 23.7 | 42.2 | 5.4 | 0.2 | 5.6 | 1.3 | 17.6 | 4.0 | 100 |
| Arts and humanities | 12.0 | 15.4 | 8.0 | 1.0 | 14.3 | 19.7 | 20.2 | 9.4 | 100 |
| Arts | 8.3 | 9.7 | 10.5 | 0.6 | 6.4 | 38.5 | 18.1 | 8.0 | 100 |
| Humanities | 14.0 | 18.4 | 6.7 | 1.2 | 18.5 | 9.8 | 21.3 | 10.2 | 100 |
| Social and behavioural sciences | 16.4 | 24.0 | 6.9 | 1.2 | 17.6 | 6.3 | 19.5 | 8.1 | 100 |
| Health care | 4.8 | 4.6 | 4.9 | 70.3 | 5.7 | 1.2 | 5.6 | 3.0 | 100 |
| Nursing | 2.1 | 0.3 | 0.4 | 93.1 | 1.6 | 0.0 | 1.2 | 0.9 | 100 |
| Health care, n.e.c. | 9.0 | 10.8 | 11.7 | 35.9 | 11.5 | 2.7 | 12.0 | 6.3 | 100 |
| Education and teaching | 4.4 | 3.6 | 1.3 | 0.4 | 79.8 | 2.1 | 4.4 | 4.0 | 100 |
| Trades, services, natural resources and conservationTable 2 Note 2 | 17.6 | 9.4 | 22.7 | 1.4 | 22.1 | 4.8 | 12.1 | 10.0 | 100 |
|
|||||||||
| Women | Men | Total | |
|---|---|---|---|
| percent | |||
| STEM | 15.4 | 9.3 | 11.4 |
| Science and science technology | 19.2 | 20.1 | 19.6 |
| Physical and chemical sciences | 17.8 | 14.7 | 15.9 |
| Biological sciences | 18.8 | 21.5 | 19.8 |
| General and integrated sciences | 21.0 | 22.2 | 21.4 |
| Engineering and engineering technology | 5.6 | 4.9 | 5.0 |
| Engineering | 5.6 | 4.9 | 5.0 |
| Mathematics and computer and information science | 12.0 | 7.1 | 8.3 |
| Mathematics and related studies | 15.2 | 11.5 | 13.1 |
| Computer and information science | 8.2 | 5.8 | 6.2 |
| BHASE (non‑STEM) | 17.0 | 23.6 | 19.2 |
| Business and administration | 19.9 | 21.8 | 20.9 |
| Arts and humanities | 27.9 | 29.7 | 28.5 |
| Arts | 26.3 | 24.9 | 25.8 |
| Humanities | 28.8 | 32.5 | 30.1 |
| Social and behavioural sciences | 24.6 | 28.7 | 26.0 |
| Health care | 3.7 | 9.2 | 4.2 |
| Nursing | 1.9 | 3.5 | 2.0 |
| Health care, n.e.c. | 11.8 | 18.6 | 13.1 |
| Education and teaching | 6.2 | 8.0 | 6.5 |
| Trades, services, natural resources and conservationTable 3 Note 2 | 15.7 | 23.9 | 18.5 |
| All fields of study | 16.8 | 18.3 | 17.4 |
|
|||
Data sources, methods and definitions
Data sources
The data in this analysis are from the 2016 Census of Population. Further information on the census can be found in the Guide to the Census of Population, 2016, Catalogue no. 98‑304‑X.
All information on the quality and comparability of census data on education can be found in the Education Reference Guide, Census of Population, 2016, Catalogue no. 98‑500‑X2016013.
Methods
The universe for this study includes graduates aged 25 to 34 who obtained a bachelor's degree and completed their education in Canada. Both the Canadian‑born population who obtained their bachelor's degree (as their highest level of education completed) in Canada, as well as immigrants who obtained their bachelor's degree (as their highest level of education completed) in Canada are included. The immigrant group includes those who immigrated to Canada at a young age.
In order to make the analysis on overqualification and occupation outcomes more comparable, the report only includes graduates from entry‑level bachelor's programs. The analysis therefore excludes bachelor's degree holders who studied 'law' or 'pharmacy,' because these programs normally require previous university education prior to entry.
Unlike the Classification of Instructional Programs (CIP), which has a group of fields of study referred to as 'science, technology, engineering and mathematics' (STEM), the National Occupational Classification (NOC) does not provide subcategories of STEM and non‑STEM occupations. Therefore, to identify the occupations of persons with a STEM degree, the occupations in the 'natural and applied sciences and related occupations' NOC category are used for and referred to as 'science and technology occupations' in this article. Note that STEM graduates may work in other occupations—they may, for example, teach, become managers or hold jobs in an entirely different field. However, this occupational group is the one that most closely corresponds to the STEM field of study, which is why it was used in this article. For additional information on this topic, see "Women in scientific occupations in Canada," Insights on Canadian Society, Catalogue no. 75‑006‑X, June 2016.
A person is considered "overqualified" when he or she has completed a bachelor's degree or higher but is working in an occupation that typically requires a high school education. In this article, all graduates have reported a bachelor's degree as their highest level of education completed. As the age group being examined is 25 to 34, many would be recent graduates and new entrants to the labour market, which could have an impact on the types of jobs and occupational categories they belonged to at the time of the census. Managerial occupations were excluded from the analysis on overqualification because the educational qualifications associated with them are non‑specific. Persons who were attending school at any level, including those who may have been pursuing subsequent degrees, were also excluded from this analysis. The reference periods for occupation and school attendance differ slightly. NOC classifications describe the main occupation worked during the reference week (May 1 to May 7, 2016), while school attendance was reported for the period from September 2015 to May 2016.
Random rounding and percentage distributions: To ensure the confidentiality of responses collected for the 2016 Census, a random rounding process is used to alter the values reported in individual cells. As a result, when these data are summed or grouped, the total value may not match the sum of the individual values, since the total and subtotals are independently rounded. Similarly, percentage distributions, which are calculated on rounded data, may not necessarily add up to 100%.
Because of random rounding, counts and percentages may vary slightly between different census products, such as the analytical documents, highlight tables and data tables.
Definitions
Please refer to the Dictionary, Census of Population, 2016, Catalogue no. 98‑301‑X for additional information on the census variables.
Additional information
Additional analyses on education can be found in The Daily of November 29, 2017, and in the Census in Brief articles entitled Is field of study a factor in the earnings of young bachelor's degree holders?, Catalogue no. 98‑200‑X2016023, and Does education pay? A comparison of earnings by level of education in Canada and its provinces and territories, Catalogue no. 98‑200‑X2016024.
Additional information on education can be found in the Highlight tables, Catalogue no. 98‑402‑X2016010; the Data tables, Catalogue nos. 98‑400‑X2016204 and 98‑400‑X2016240 to 98‑400‑X2016280; the Census Profile, Catalogue no. 98‑316‑X2016001; and the Focus on Geography Series, Catalogue no. 98‑404‑X2016001.
Thematic maps for this topic are also available for Canada by census division.
An infographic entitled Canada's educational portrait also illustrates some key findings on education in Canada.
For details on the concepts, definitions and variables used in the 2016 Census of Population, please consult the Dictionary, Census of Population, 2016, Catalogue no. 98‑301‑X.
In addition to response rates and other data quality information, the Guide to the Census of Population, 2016, Catalogue no. 98‑304‑X, provides an overview of the various phases of the census including content determination, sampling design, collection, data processing, data quality assessment, confidentiality guidelines and dissemination.
Acknowledgments
This report was prepared by John Zhao, Sarah Jane Ferguson, Heather Dryburgh, Carlos Rodriguez, Laura Gibson, Katherine Wall and Rajendra Subedi of Statistics Canada's Tourism and Centre for Education Statistics Division, with the assistance of other staff members in that division, and the collaboration of staff members of the Census Subject Matter Secretariat, Census Operations Division, and Communications and Dissemination Branch.
- Date modified: