
Dictionary, Census of Population, 2016
Figure 1.9
Spatial contiguity rule
Description of Figure 1.9
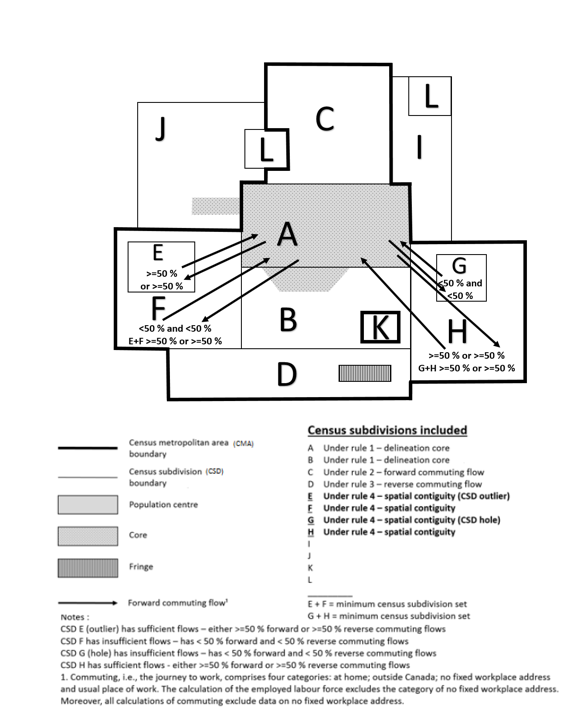
Figure 1.9 is a graphical representation of the spatial contiguity rule (rule 4Figure 1.9 - note 1) for delineating a census metropolitan area (CMA). A fictional grouping of 12 census subdivisions (CSDs), shown as polygons labelled 'A' through 'L,' represent the group of CSDs that could form a CMA.
All of CSD A and a small portion of the adjacent CSDs B and J are shaded to represent a population centre. This population centre also makes up the core of the CMA. Census subdivision D has a small, shaded polygon within it that identifies a population centre that is not part of the core and is therefore referred to as fringe.
Census subdivision F, which is adjacent to CSDs A and B (part of the CMA), is shown to have insufficient commuting flows (either forward or reverse). However, it completely contains a smaller CSD (CSD E) which is shown to have sufficient commuting flows. CSD E is considered to be an outlier. The combined commuting flows of CSD E and CSD F are shown to be sufficient to make them eligible for inclusion in the CMA. The commuting flows of these CSDs are represented in this figure by arrows in both directions, i.e., leading to and from the delineation core (CSDs A and B).
Census subdivision H, which is adjacent to CSDs A and B (part of the CMA), is shown to have sufficient commuting flows (either forward or reverse). However, it completely contains a smaller CSD (CSD G) which is shown to have insufficient commuting flows. CSD G is considered to be a hole. Like CSDs E and F, the combined commuting flows of these two CSDs (CSD G and CSD H) are shown to be sufficient to make them eligible for inclusion in the CMA. The commuting flows of these CSDs are represented in this figure by arrows in both directions, i.e., leading to and from the delineation core (CSDs A and B).
A thick black line outlines the perimeter of CSDs A, B, C, D, E, F, G, H and excludes CSD K, leaving a hole, to identify the new boundary of the CMA.
Two legends appear below the figure. The legend on the left identifies the symbols used in the figure to represent the boundaries of the CMA, CSD, population centre, core, fringe and the arrow indicating commuting flow. The legend on the right distinguishes which CSDs are included in the CMA according to their inclusion criteria. For this figure, CSDs A and B are included under rule 1 (delineation core rule), CSD C is included under rule 2 (forward commuting flow rule), CSD D is included under rule 3 (reverse commuting flow rule), and CSDs E, F, G and H are included under rule 4 (spatial contiguity rule).
Source: Statistics Canada, 2016 Census of Population.
- Date modified: