
Archived Content
Information identified as archived is provided for reference, research or recordkeeping purposes. It is not subject to the Government of Canada Web Standards and has not been altered or updated since it was archived. Please contact us to request a format other than those available.
NHS Profile, Beauséjour, New Brunswick, 2011
NHS data
NHS data
| Characteristic |
Beauséjour
New Brunswick (Federal electoral district, 2013 Representation Order) |
||
|---|---|---|---|
| Total | Male | Female | |
| Citizenship | |||
| Total population in private households by citizenshipNational Household Survey data footnote 1 | 77,985 | 38,805 | 39,185 |
| Canadian citizens | 77,005 | 38,285 | 38,715 |
| Canadian citizens aged under 18 | 13,935 | 7,315 | 6,625 |
| Canadian citizens aged 18 and over | 63,065 | 30,970 | 32,090 |
| Not Canadian citizensNational Household Survey data footnote 2 | 980 | 515 | 465 |
| Immigrant status and period of immigration | |||
| Total population in private households by immigrant status and period of immigrationNational Household Survey data footnote 3 | 77,985 | 38,800 | 39,185 |
| Non-immigrantsNational Household Survey data footnote 4 | 75,305 | 37,530 | 37,775 |
| ImmigrantsNational Household Survey data footnote 5 | 2,535 | 1,175 | 1,360 |
| Before 1971 | 500 | 270 | 235 |
| 1971 to 1980 | 815 | 325 | 490 |
| 1981 to 1990 | 225 | 80 | 145 |
| 1991 to 2000 | 295 | 155 | 135 |
| 2001 to 2011National Household Survey data footnote 6 | 705 | 345 | 355 |
| 2001 to 2005 | 200 | 60 | 140 |
| 2006 to 2011National Household Survey data footnote 6 | 505 | 285 | 220 |
| Non-permanent residentsNational Household Survey data footnote 7 | 140 | 95 | 50 |
| Age at immigration | |||
| Total immigrant population in private households by age at immigrationNational Household Survey data footnote 8 | 2,535 | 1,175 | 1,360 |
| Under 5 years | 530 | 255 | 270 |
| 5 to 14 years | 615 | 230 | 380 |
| 15 to 24 years | 355 | 175 | 180 |
| 25 to 44 years | 890 | 445 | 450 |
| 45 years and over | 145 | 70 | 75 |
| Immigrant status and selected places of birth | |||
| Total population in private households by immigrant status and selected places of birthNational Household Survey data footnote 9 | 77,980 | 38,800 | 39,185 |
| Non-immigrantsNational Household Survey data footnote 10 | 75,305 | 37,530 | 37,775 |
| Born in province of residence | 64,400 | 31,820 | 32,575 |
| Born outside province of residence | 10,905 | 5,710 | 5,195 |
| ImmigrantsNational Household Survey data footnote 11 | 2,535 | 1,180 | 1,355 |
| Americas | 1,220 | 500 | 720 |
| United States | 990 | 415 | 580 |
| Jamaica | 0 | 0 | 0 |
| Guyana | 0 | 0 | 0 |
| Haiti | 0 | 0 | 0 |
| Mexico | 0 | 0 | 0 |
| Trinidad and Tobago | 0 | 0 | 0 |
| Colombia | 65 | 0 | 60 |
| El Salvador | 0 | 0 | 0 |
| Peru | 0 | 0 | 0 |
| Chile | 0 | 0 | 0 |
| Other places of birth in Americas | 120 | 55 | 70 |
| Europe | 920 | 480 | 440 |
| United KingdomNational Household Survey data footnote 12 | 360 | 195 | 170 |
| Italy | 0 | 0 | 0 |
| Germany | 225 | 110 | 115 |
| Poland | 0 | 0 | 0 |
| Portugal | 0 | 0 | 0 |
| Netherlands | 130 | 55 | 75 |
| France | 90 | 50 | 45 |
| Romania | 0 | 0 | 0 |
| Russian Federation | 0 | 0 | 0 |
| Greece | 0 | 0 | 0 |
| Ukraine | 0 | 0 | 0 |
| Croatia | 0 | 0 | 0 |
| Hungary | 0 | 0 | 0 |
| Bosnia and Herzegovina | 0 | 0 | 0 |
| Serbia | 0 | 0 | 0 |
| Ireland, Republic of | 0 | 0 | 0 |
| Other places of birth in Europe | 65 | 50 | 0 |
| Africa | 100 | 55 | 45 |
| Morocco | 0 | 0 | 0 |
| Algeria | 0 | 0 | 0 |
| Egypt | 0 | 0 | 0 |
| South Africa, Republic of | 0 | 0 | 0 |
| Nigeria | 0 | 0 | 0 |
| Ethiopia | 0 | 0 | 0 |
| Kenya | 0 | 0 | 0 |
| Other places of birth in Africa | 30 | 20 | 0 |
| Asia | 280 | 130 | 155 |
| India | 0 | 0 | 0 |
| ChinaNational Household Survey data footnote 13 | 20 | 0 | 15 |
| Philippines | 55 | 0 | 50 |
| Hong Kong Special Administrative Region | 0 | 0 | 0 |
| Viet NamNational Household Survey data footnote 14 | 0 | 0 | 0 |
| Pakistan | 0 | 0 | 0 |
| Sri Lanka | 0 | 0 | 0 |
| IranNational Household Survey data footnote 15 | 0 | 0 | 0 |
| Korea, SouthNational Household Survey data footnote 16 | 135 | 80 | 55 |
| Lebanon | 0 | 0 | 0 |
| Taiwan | 0 | 0 | 0 |
| Iraq | 0 | 0 | 0 |
| Bangladesh | 0 | 0 | 0 |
| Afghanistan | 0 | 0 | 0 |
| Japan | 0 | 0 | 0 |
| Turkey | 0 | 0 | 0 |
| Other places of birth in Asia | 0 | 0 | 0 |
| Oceania and otherNational Household Survey data footnote 17 | 0 | 0 | 0 |
| Fiji | 0 | 0 | 0 |
| Other places of birthNational Household Survey data footnote 18 | 0 | 0 | 0 |
| Non-permanent residentsNational Household Survey data footnote 19 | 145 | 95 | 50 |
| Recent immigrants by selected place of birth | |||
| Total recent immigrant population in private households by selected places of birthNational Household Survey data footnote 20 | 500 | 285 | 215 |
| Americas | 65 | 45 | 20 |
| United States | 45 | 30 | 10 |
| Mexico | 0 | 0 | 0 |
| Cuba | 0 | 0 | 0 |
| Haiti | 0 | 0 | 0 |
| Jamaica | 0 | 0 | 0 |
| Brazil | 0 | 0 | 0 |
| Colombia | 0 | 0 | 0 |
| Guyana | 0 | 0 | 0 |
| Peru | 0 | 0 | 0 |
| VenezuelaNational Household Survey data footnote 21 | 0 | 0 | 0 |
| Other places of birth in Americas | 0 | 0 | 0 |
| Europe | 205 | 105 | 100 |
| France | 45 | 25 | 20 |
| Germany | 25 | 0 | 0 |
| Poland | 0 | 0 | 0 |
| Romania | 0 | 0 | 0 |
| MoldovaNational Household Survey data footnote 22 | 0 | 0 | 0 |
| Russian Federation | 0 | 0 | 0 |
| Ukraine | 0 | 0 | 0 |
| United KingdomNational Household Survey data footnote 12 | 65 | 35 | 30 |
| Other places of birth in Europe | 65 | 35 | 35 |
| Africa | 60 | 30 | 30 |
| Nigeria | 0 | 0 | 0 |
| Ethiopia | 0 | 0 | 0 |
| Mauritius | 0 | 0 | 0 |
| Somalia | 0 | 0 | 0 |
| Algeria | 0 | 0 | 0 |
| Egypt | 0 | 0 | 0 |
| Morocco | 0 | 0 | 0 |
| Tunisia | 0 | 0 | 0 |
| Cameroon | 0 | 0 | 0 |
| Congo, The Democratic Republic of the | 0 | 0 | 0 |
| South Africa, Republic of | 0 | 0 | 0 |
| Other places of birth in Africa | 0 | 0 | 0 |
| Asia | 170 | 95 | 70 |
| Philippines | 0 | 0 | 0 |
| ChinaNational Household Survey data footnote 13 | 0 | 0 | 0 |
| India | 0 | 0 | 0 |
| Pakistan | 0 | 0 | 0 |
| IranNational Household Survey data footnote 15 | 0 | 0 | 0 |
| South KoreaNational Household Survey data footnote 16 | 130 | 80 | 55 |
| Sri Lanka | 0 | 0 | 0 |
| Iraq | 0 | 0 | 0 |
| Bangladesh | 0 | 0 | 0 |
| Lebanon | 0 | 0 | 0 |
| Viet NamNational Household Survey data footnote 14 | 0 | 0 | 0 |
| Taiwan | 0 | 0 | 0 |
| Afghanistan | 0 | 0 | 0 |
| Japan | 0 | 0 | 0 |
| Turkey | 0 | 0 | 0 |
| Israel | 0 | 0 | 0 |
| Nepal | 0 | 0 | 0 |
| Hong Kong Special Administrative Region | 0 | 0 | 0 |
| United Arab Emirates | 0 | 0 | 0 |
| Saudi Arabia | 0 | 0 | 0 |
| SyriaNational Household Survey data footnote 23 | 0 | 0 | 0 |
| Other places of birth in Asia | 0 | 0 | 0 |
| Oceania and otherNational Household Survey data footnote 17 | 0 | 0 | 0 |
| Generation status | |||
| Total population in private households by generation statusNational Household Survey data footnote 24 | 77,985 | 38,800 | 39,180 |
| First generationNational Household Survey data footnote 25 | 2,755 | 1,300 | 1,455 |
| Second generationNational Household Survey data footnote 26 | 3,700 | 1,815 | 1,885 |
| Third generation or moreNational Household Survey data footnote 27 | 71,530 | 35,690 | 35,840 |
| Visible minority population | |||
| Total population in private households by visible minority | 77,985 | 38,800 | 39,180 |
| Total visible minority populationNational Household Survey data footnote 28 | 920 | 445 | 480 |
| South AsianNational Household Survey data footnote 29 | 60 | 30 | 30 |
| Chinese | 105 | 40 | 65 |
| Black | 255 | 170 | 80 |
| Filipino | 75 | 0 | 60 |
| Latin American | 165 | 35 | 130 |
| Arab | 55 | 35 | 0 |
| Southeast AsianNational Household Survey data footnote 30 | 35 | 25 | 0 |
| West AsianNational Household Survey data footnote 31 | 0 | 0 | 0 |
| Korean | 145 | 80 | 65 |
| Japanese | 0 | 0 | 0 |
| Visible minority, n.i.e.National Household Survey data footnote 32 | 0 | 0 | 0 |
| Multiple visible minoritiesNational Household Survey data footnote 33 | 10 | 0 | 0 |
| Not a visible minorityNational Household Survey data footnote 34 | 77,060 | 38,355 | 38,705 |
| Ethnic origin population | |||
| Total population in private households by ethnic originsNational Household Survey data footnote 35 | 77,980 | 38,800 | 39,180 |
| North American Aboriginal origins | 3,310 | 1,515 | 1,795 |
| First Nations (North American Indian) | 2,455 | 1,035 | 1,425 |
| Inuit | 70 | 55 | 15 |
| Métis | 910 | 500 | 410 |
| Other North American origins | 52,075 | 26,050 | 26,020 |
| Acadian | 9,860 | 4,935 | 4,930 |
| American | 420 | 245 | 180 |
| Canadian | 46,295 | 23,010 | 23,280 |
| New Brunswicker | 30 | 20 | 15 |
| Newfoundlander | 15 | 10 | 0 |
| Nova Scotian | 0 | 0 | 0 |
| Ontarian | 0 | 0 | 0 |
| Québécois | 80 | 40 | 50 |
| Other North American origins, n.i.e.National Household Survey data footnote 36 | 0 | 0 | 0 |
| European origins | 47,255 | 23,485 | 23,765 |
| British Isles origins | 22,840 | 11,020 | 11,815 |
| Channel Islander | 0 | 0 | 0 |
| Cornish | 0 | 0 | 0 |
| English | 13,190 | 6,495 | 6,700 |
| Irish | 8,835 | 4,180 | 4,660 |
| Manx | 0 | 0 | 0 |
| Scottish | 7,750 | 3,725 | 4,030 |
| Welsh | 405 | 215 | 190 |
| British Isles origins, n.i.e.National Household Survey data footnote 37 | 760 | 355 | 405 |
| French origins | 30,650 | 15,320 | 15,330 |
| Alsatian | 0 | 0 | 0 |
| Breton | 0 | 0 | 0 |
| French | 30,650 | 15,320 | 15,330 |
| Western European origins (except French origins) | 3,745 | 1,980 | 1,770 |
| Austrian | 70 | 40 | 30 |
| Belgian | 225 | 150 | 70 |
| Dutch | 580 | 305 | 275 |
| Flemish | 0 | 0 | 0 |
| Frisian | 60 | 0 | 0 |
| German | 2,765 | 1,405 | 1,365 |
| Luxembourger | 0 | 0 | 0 |
| Swiss | 225 | 135 | 95 |
| Western European origins, n.i.e.National Household Survey data footnote 38 | 10 | 0 | 0 |
| Northern European origins (except British Isles origins) | 520 | 295 | 220 |
| Danish | 90 | 50 | 40 |
| Finnish | 15 | 0 | 0 |
| Icelandic | 0 | 0 | 0 |
| Norwegian | 255 | 165 | 90 |
| Swedish | 115 | 45 | 70 |
| Northern European origins, n.i.e.National Household Survey data footnote 39 | 65 | 40 | 25 |
| Eastern European origins | 930 | 385 | 545 |
| Bulgarian | 0 | 0 | 0 |
| Byelorussian | 0 | 0 | 0 |
| Czech | 35 | 0 | 30 |
| Czechoslovakian, n.o.s. | 90 | 55 | 35 |
| Estonian | 0 | 0 | 0 |
| Hungarian | 145 | 75 | 70 |
| Latvian | 0 | 0 | 0 |
| Lithuanian | 0 | 0 | 0 |
| Moldovan | 0 | 0 | 0 |
| Polish | 315 | 145 | 165 |
| Romanian | 100 | 45 | 55 |
| Russian | 135 | 50 | 80 |
| Slovak | 20 | 0 | 20 |
| Ukrainian | 295 | 100 | 195 |
| Eastern European origins, n.i.e.National Household Survey data footnote 40 | 0 | 0 | 0 |
| Southern European origins | 875 | 390 | 485 |
| Albanian | 0 | 0 | 0 |
| Bosnian | 0 | 0 | 0 |
| Croatian | 0 | 0 | 0 |
| Cypriot | 0 | 0 | 0 |
| Greek | 25 | 0 | 20 |
| Italian | 605 | 295 | 310 |
| Kosovar | 0 | 0 | 0 |
| Macedonian | 0 | 0 | 0 |
| Maltese | 0 | 0 | 0 |
| Montenegrin | 0 | 0 | 0 |
| Portuguese | 50 | 20 | 30 |
| Serbian | 0 | 0 | 0 |
| Sicilian | 0 | 0 | 0 |
| Slovenian | 0 | 0 | 0 |
| Spanish | 165 | 55 | 105 |
| Yugoslavian, n.o.s. | 0 | 0 | 0 |
| Southern European origins, n.i.e.National Household Survey data footnote 41 | 0 | 0 | 0 |
| Other European origins | 220 | 130 | 90 |
| Basque | 0 | 0 | 0 |
| Jewish | 115 | 70 | 0 |
| Roma (Gypsy) | 0 | 0 | 0 |
| Slavic, n.o.s. | 0 | 0 | 0 |
| Other European origins, n.i.e.National Household Survey data footnote 42 | 105 | 60 | 45 |
| Caribbean origins | 85 | 50 | 30 |
| Antiguan | 0 | 0 | 0 |
| Bahamian | 0 | 0 | 0 |
| Barbadian | 0 | 0 | 0 |
| Bermudan | 0 | 0 | 0 |
| Carib | 0 | 0 | 0 |
| Cuban | 0 | 0 | 0 |
| Dominican | 0 | 0 | 0 |
| Grenadian | 0 | 0 | 0 |
| Haitian | 0 | 0 | 0 |
| Jamaican | 20 | 20 | 0 |
| Kittitian/Nevisian | 0 | 0 | 0 |
| Martinican | 0 | 0 | 0 |
| Montserratan | 0 | 0 | 0 |
| Puerto Rican | 0 | 0 | 0 |
| St. Lucian | 0 | 0 | 0 |
| Trinidadian/Tobagonian | 0 | 0 | 0 |
| Vincentian/Grenadinian | 0 | 0 | 0 |
| West Indian, n.o.s. | 30 | 0 | 0 |
| Caribbean origins, n.i.e.National Household Survey data footnote 43 | 0 | 0 | 0 |
| Latin, Central and South American origins | 270 | 85 | 185 |
| Aboriginal from Central/South America (except Maya) | 0 | 0 | 0 |
| Argentinian | 0 | 0 | 0 |
| Belizean | 0 | 0 | 0 |
| Bolivian | 0 | 0 | 0 |
| Brazilian | 45 | 0 | 0 |
| Chilean | 30 | 0 | 0 |
| Colombian | 65 | 0 | 60 |
| Costa Rican | 0 | 0 | 0 |
| Ecuadorian | 0 | 0 | 0 |
| Guatemalan | 0 | 0 | 0 |
| Guyanese | 0 | 0 | 0 |
| Hispanic | 0 | 0 | 0 |
| Honduran | 0 | 0 | 0 |
| Maya | 0 | 0 | 0 |
| Mexican | 20 | 0 | 0 |
| Nicaraguan | 0 | 0 | 0 |
| Panamanian | 0 | 0 | 0 |
| Paraguayan | 0 | 0 | 0 |
| Peruvian | 0 | 0 | 0 |
| Salvadorean | 0 | 0 | 0 |
| Uruguayan | 0 | 0 | 0 |
| Venezuelan | 0 | 0 | 0 |
| Latin, Central and South American origins, n.i.e.National Household Survey data footnote 44 | 0 | 0 | 0 |
| African origins | 285 | 170 | 120 |
| Central and West African origins | 45 | 30 | 0 |
| Akan | 0 | 0 | 0 |
| Angolan | 0 | 0 | 0 |
| Ashanti | 0 | 0 | 0 |
| Beninese | 0 | 0 | 0 |
| Burkinabe | 0 | 0 | 0 |
| Cameroonian | 0 | 0 | 0 |
| Chadian | 0 | 0 | 0 |
| Congolese | 40 | 0 | 0 |
| Gabonese | 0 | 0 | 0 |
| Gambian | 0 | 0 | 0 |
| Ghanaian | 0 | 0 | 0 |
| Guinean | 0 | 0 | 0 |
| Ibo | 0 | 0 | 0 |
| Ivorian | 0 | 0 | 0 |
| Liberian | 0 | 0 | 0 |
| Malian | 0 | 0 | 0 |
| Nigerian | 0 | 0 | 0 |
| Peulh | 0 | 0 | 0 |
| Senegalese | 0 | 0 | 0 |
| Sierra Leonean | 0 | 0 | 0 |
| Togolese | 0 | 0 | 0 |
| Yoruba | 0 | 0 | 0 |
| Central and West African origins, n.i.e.National Household Survey data footnote 45 | 0 | 0 | 0 |
| North African origins | 20 | 0 | 0 |
| Algerian | 0 | 0 | 0 |
| Berber | 0 | 0 | 0 |
| Coptic | 0 | 0 | 0 |
| Dinka | 0 | 0 | 0 |
| Egyptian | 0 | 0 | 0 |
| Libyan | 0 | 0 | 0 |
| Maure | 0 | 0 | 0 |
| Moroccan | 15 | 0 | 0 |
| Sudanese | 0 | 0 | 0 |
| Tunisian | 15 | 0 | 0 |
| North African origins, n.i.e.National Household Survey data footnote 46 | 0 | 0 | 0 |
| Southern and East African origins | 80 | 45 | 40 |
| Afrikaner | 0 | 0 | 0 |
| Amhara | 0 | 0 | 0 |
| Bantu, n.o.s. | 0 | 0 | 0 |
| Burundian | 0 | 0 | 0 |
| Eritrean | 0 | 0 | 0 |
| Ethiopian | 0 | 0 | 0 |
| Harari | 0 | 0 | 0 |
| Kenyan | 0 | 0 | 0 |
| Malagasy | 0 | 0 | 0 |
| Mauritian | 0 | 0 | 0 |
| Oromo | 0 | 0 | 0 |
| Rwandan | 0 | 0 | 0 |
| Seychellois | 0 | 0 | 0 |
| Somali | 0 | 0 | 0 |
| South African | 20 | 0 | 0 |
| Tanzanian | 0 | 0 | 0 |
| Tigrian | 0 | 0 | 0 |
| Ugandan | 0 | 0 | 0 |
| Zambian | 0 | 0 | 0 |
| Zimbabwean | 0 | 0 | 0 |
| Zulu | 0 | 0 | 0 |
| Southern and East African origins, n.i.e.National Household Survey data footnote 47 | 0 | 0 | 0 |
| Other African origins | 150 | 95 | 60 |
| Black, n.o.s.National Household Survey data footnote 48 | 0 | 0 | 0 |
| Other African origins, n.i.e.National Household Survey data footnote 49 | 145 | 85 | 60 |
| Asian origins | 710 | 370 | 345 |
| West Central Asian and Middle Eastern origins | 210 | 120 | 90 |
| Afghan | 0 | 0 | 0 |
| Arab, n.o.s. | 0 | 0 | 0 |
| Armenian | 20 | 0 | 0 |
| Assyrian | 0 | 0 | 0 |
| Azerbaijani | 0 | 0 | 0 |
| Georgian | 0 | 0 | 0 |
| Iranian | 50 | 0 | 0 |
| Iraqi | 0 | 0 | 0 |
| Israeli | 0 | 0 | 0 |
| Jordanian | 0 | 0 | 0 |
| Kazakh | 0 | 0 | 0 |
| Kurd | 0 | 0 | 0 |
| Kuwaiti | 0 | 0 | 0 |
| Lebanese | 100 | 60 | 40 |
| Palestinian | 0 | 0 | 0 |
| Pashtun | 0 | 0 | 0 |
| Saudi Arabian | 0 | 0 | 0 |
| Syrian | 30 | 0 | 15 |
| Tajik | 0 | 0 | 0 |
| Tatar | 0 | 0 | 0 |
| Turk | 0 | 0 | 0 |
| Uighur | 0 | 0 | 0 |
| Uzbek | 0 | 0 | 0 |
| Yemeni | 0 | 0 | 0 |
| West Central Asian and Middle Eastern origins, n.i.e.National Household Survey data footnote 50 | 0 | 0 | 0 |
| South Asian origins | 115 | 85 | 35 |
| Bangladeshi | 0 | 0 | 0 |
| Bengali | 0 | 0 | 0 |
| East IndianNational Household Survey data footnote 48 | 110 | 75 | 35 |
| Goan | 0 | 0 | 0 |
| Gujarati | 0 | 0 | 0 |
| Kashmiri | 0 | 0 | 0 |
| Nepali | 0 | 0 | 0 |
| Pakistani | 0 | 0 | 0 |
| Punjabi | 0 | 0 | 0 |
| Sinhalese | 0 | 0 | 0 |
| Sri Lankan | 0 | 0 | 0 |
| Tamil | 0 | 0 | 0 |
| South Asian origins, n.i.e.National Household Survey data footnote 51 | 0 | 0 | 0 |
| East and Southeast Asian origins | 395 | 165 | 230 |
| Burmese | 0 | 0 | 0 |
| Cambodian (Khmer) | 0 | 0 | 0 |
| Chinese | 125 | 45 | 80 |
| Filipino | 90 | 0 | 80 |
| Hmong | 0 | 0 | 0 |
| Indonesian | 0 | 0 | 0 |
| Japanese | 0 | 0 | 0 |
| Korean | 145 | 75 | 70 |
| Laotian | 0 | 0 | 0 |
| Malaysian | 0 | 0 | 0 |
| Mongolian | 0 | 0 | 0 |
| Singaporean | 0 | 0 | 0 |
| Taiwanese | 0 | 0 | 0 |
| Thai | 0 | 0 | 0 |
| Tibetan | 0 | 0 | 0 |
| Vietnamese | 0 | 0 | 0 |
| East and Southeast Asian origins, n.i.e.National Household Survey data footnote 52 | 0 | 0 | 0 |
| Other Asian origins | 0 | 0 | 0 |
| Other Asian origins, n.i.e.National Household Survey data footnote 53 | 0 | 0 | 0 |
| Oceania origins | 0 | 0 | 0 |
| Australian | 0 | 0 | 0 |
| New Zealander | 0 | 0 | 0 |
| Pacific Islands origins | 0 | 0 | 0 |
| Fijian | 0 | 0 | 0 |
| Hawaiian | 0 | 0 | 0 |
| Maori | 0 | 0 | 0 |
| Polynesian, n.o.s. | 0 | 0 | 0 |
| Samoan | 0 | 0 | 0 |
| Pacific Islands origins, n.i.e.National Household Survey data footnote 54 | 0 | 0 | 0 |
| Religion | |||
| Total population in private households by religionNational Household Survey data footnote 55 | 77,985 | 38,800 | 39,180 |
| Buddhist | 35 | 0 | 0 |
| Christian | 69,165 | 33,800 | 35,365 |
| Anglican | 2,195 | 900 | 1,300 |
| Baptist | 4,115 | 2,010 | 2,100 |
| Catholic | 55,705 | 27,245 | 28,465 |
| Christian Orthodox | 40 | 0 | 30 |
| Lutheran | 80 | 35 | 50 |
| Pentecostal | 650 | 345 | 305 |
| Presbyterian | 575 | 285 | 290 |
| United Church | 3,220 | 1,630 | 1,590 |
| Other Christian | 2,580 | 1,345 | 1,240 |
| Hindu | 0 | 0 | 0 |
| Jewish | 65 | 45 | 20 |
| Muslim | 0 | 0 | 0 |
| Sikh | 0 | 0 | 0 |
| Traditional (Aboriginal) Spirituality | 55 | 30 | 25 |
| Other religions | 110 | 50 | 65 |
| No religious affiliation | 8,510 | 4,815 | 3,695 |
| Aboriginal population | |||
| Total population in private households by Aboriginal identity | 77,980 | 38,805 | 39,185 |
| Aboriginal identityNational Household Survey data footnote 56 | 2,015 | 980 | 1,035 |
| First Nations (North American Indian) single identityNational Household Survey data footnote 57 | 975 | 440 | 540 |
| Métis single identity | 840 | 435 | 410 |
| Inuk (Inuit) single identity | 70 | 50 | 0 |
| Multiple Aboriginal identitiesNational Household Survey data footnote 58 | 0 | 0 | 0 |
| Aboriginal identities not included elsewhereNational Household Survey data footnote 59 | 115 | 65 | 55 |
| Non-Aboriginal identity | 75,970 | 37,815 | 38,150 |
| Total population in private households by Registered or Treaty Indian statusNational Household Survey data footnote 57 | 77,985 | 38,805 | 39,185 |
| Registered or Treaty IndianNational Household Survey data footnote 60 | 590 | 285 | 305 |
| Not a Registered or Treaty Indian | 77,395 | 38,515 | 38,875 |
| Total population in private households by Aboriginal ancestryNational Household Survey data footnote 61 | 77,980 | 38,805 | 39,185 |
| Aboriginal ancestryNational Household Survey data footnote 62 | 3,305 | 1,510 | 1,795 |
| First Nations (North American Indian) Aboriginal ancestryNational Household Survey data footnote 57 | 2,460 | 1,030 | 1,425 |
| Métis ancestry | 910 | 495 | 410 |
| Inuit ancestry | 70 | 50 | 15 |
| Non-Aboriginal ancestry onlyNational Household Survey data footnote 63 | 74,675 | 37,290 | 37,385 |
| Non-official languages spoken | |||
| Total population in private households by non-official languages spokenNational Household Survey data footnote 64 | 1,975 | 955 | 1,020 |
| Aboriginal languages | 110 | 55 | 60 |
| Algonquin | 0 | 0 | 0 |
| Atikamekw | 0 | 0 | 0 |
| Blackfoot | 0 | 0 | 0 |
| Cree languagesNational Household Survey data footnote 65 | 0 | 0 | 0 |
| Mi'kmaq | 105 | 45 | 60 |
| Innu/Montagnais | 0 | 0 | 0 |
| Ojibway | 0 | 0 | 0 |
| Oji-Cree | 0 | 0 | 0 |
| Carrier | 0 | 0 | 0 |
| Dene | 0 | 0 | 0 |
| Tlicho (Dogrib) | 0 | 0 | 0 |
| Slavey, n.o.s. | 0 | 0 | 0 |
| Stoney | 0 | 0 | 0 |
| Inuktitut | 0 | 0 | 0 |
| Other Aboriginal languagesNational Household Survey data footnote 66 | 0 | 0 | 0 |
| Non-Aboriginal languages | 1,865 | 905 | 965 |
| Italian | 115 | 80 | 40 |
| Portuguese | 35 | 15 | 15 |
| Romanian | 0 | 0 | 0 |
| Spanish | 615 | 280 | 335 |
| Dutch | 130 | 50 | 80 |
| Flemish | 0 | 0 | 0 |
| German | 445 | 260 | 180 |
| Yiddish | 0 | 0 | 0 |
| Danish | 0 | 0 | 0 |
| Norwegian | 0 | 0 | 0 |
| Swedish | 25 | 0 | 20 |
| Afrikaans | 0 | 0 | 0 |
| Gaelic languages | 0 | 0 | 0 |
| Bosnian | 0 | 0 | 0 |
| Bulgarian | 0 | 0 | 0 |
| Croatian | 0 | 0 | 0 |
| Czech | 20 | 0 | 20 |
| Macedonian | 0 | 0 | 0 |
| Polish | 15 | 0 | 0 |
| Russian | 0 | 0 | 0 |
| Serbian | 0 | 0 | 0 |
| Serbo-Croatian | 0 | 0 | 0 |
| Slovak | 0 | 0 | 0 |
| Slovenian | 0 | 0 | 0 |
| Ukrainian | 0 | 0 | 0 |
| Latvian | 0 | 0 | 0 |
| Lithuanian | 0 | 0 | 0 |
| Greek | 0 | 0 | 0 |
| Armenian | 15 | 0 | 0 |
| Albanian | 0 | 0 | 0 |
| Estonian | 0 | 0 | 0 |
| Finnish | 0 | 0 | 0 |
| Hungarian | 0 | 0 | 0 |
| Turkish | 0 | 0 | 0 |
| Berber languages (Kabyle) | 0 | 0 | 0 |
| Oromo | 0 | 0 | 0 |
| Somali | 0 | 0 | 0 |
| Amharic | 0 | 0 | 0 |
| Arabic | 80 | 45 | 35 |
| Hebrew | 0 | 0 | 0 |
| Maltese | 0 | 0 | 0 |
| Tigrigna | 0 | 0 | 0 |
| Semitic languages, n.i.e. | 0 | 0 | 0 |
| Bengali | 0 | 0 | 0 |
| Gujarati | 0 | 0 | 0 |
| Hindi | 0 | 0 | 0 |
| Konkani | 0 | 0 | 0 |
| Marathi | 0 | 0 | 0 |
| Panjabi (Punjabi) | 0 | 0 | 0 |
| Sindhi | 0 | 0 | 0 |
| Sinhala (Sinhalese) | 0 | 0 | 0 |
| Urdu | 0 | 0 | 0 |
| Nepali | 0 | 0 | 0 |
| Kurdish | 0 | 0 | 0 |
| Pashto | 0 | 0 | 0 |
| Persian (Farsi) | 0 | 0 | 0 |
| Indo-Iranian languages, n.i.e. | 0 | 0 | 0 |
| Kannada | 0 | 0 | 0 |
| Malayalam | 0 | 0 | 0 |
| Tamil | 0 | 0 | 0 |
| Telugu | 0 | 0 | 0 |
| Japanese | 25 | 0 | 0 |
| Korean | 155 | 90 | 60 |
| Cantonese | 0 | 0 | 0 |
| Fukien | 0 | 0 | 0 |
| Hakka | 0 | 0 | 0 |
| Mandarin | 0 | 0 | 0 |
| Taiwanese | 0 | 0 | 0 |
| Chinese, n.o.s. | 15 | 0 | 0 |
| Lao | 0 | 0 | 0 |
| Thai | 0 | 0 | 0 |
| Khmer (Cambodian) | 0 | 0 | 0 |
| Vietnamese | 0 | 0 | 0 |
| Bisayan languages | 0 | 0 | 0 |
| Ilocano | 0 | 0 | 0 |
| Malay | 0 | 0 | 0 |
| Tagalog (Pilipino,Filipino) | 75 | 0 | 60 |
| Akan (Twi) | 0 | 0 | 0 |
| Lingala | 0 | 0 | 0 |
| Rundi (Kirundi) | 0 | 0 | 0 |
| Rwanda (Kinyarwanda) | 0 | 0 | 0 |
| Swahili | 0 | 0 | 0 |
| Bantu languages, n.i.e. | 0 | 0 | 0 |
| Niger-Congo languages, n.i.e. | 0 | 0 | 0 |
| African languages, n.i.e. | 0 | 0 | 0 |
| Creoles | 40 | 0 | 20 |
| Other non-Aboriginal languagesNational Household Survey data footnote 67 | 135 | 55 | 85 |
| Mobility | |||
| Total - Mobility status 1 year agoNational Household Survey data footnote 68 | 77,405 | 38,575 | 38,835 |
| Non-movers | 69,990 | 34,890 | 35,100 |
| Movers | 7,415 | 3,680 | 3,735 |
| Non-migrants | 3,510 | 1,775 | 1,735 |
| Migrants | 3,905 | 1,905 | 1,995 |
| Internal migrants | 3,675 | 1,795 | 1,870 |
| Intraprovincial migrants | 2,565 | 1,295 | 1,265 |
| Interprovincial migrants | 1,110 | 505 | 605 |
| External migrants | 230 | 110 | 125 |
| Total - Mobility status 5 years agoNational Household Survey data footnote 69 | 74,180 | 36,835 | 37,340 |
| Non-movers | 51,400 | 25,525 | 25,875 |
| Movers | 22,780 | 11,315 | 11,465 |
| Non-migrants | 10,395 | 5,105 | 5,290 |
| Migrants | 12,390 | 6,205 | 6,180 |
| Internal migrants | 11,690 | 5,830 | 5,860 |
| Intraprovincial migrants | 8,045 | 3,930 | 4,115 |
| Interprovincial migrants | 3,645 | 1,905 | 1,740 |
| External migrants | 700 | 375 | 325 |
| Education | |||
| Total population aged 15 years and over by highest certificate, diploma or degreeNational Household Survey data footnote 70 | 66,490 | 32,855 | 33,635 |
| No certificate, diploma or degree | 18,625 | 9,565 | 9,065 |
| High school diploma or equivalentNational Household Survey data footnote 71 | 15,880 | 8,005 | 7,870 |
| Postsecondary certificate, diploma or degreeNational Household Survey data footnote 72 | 31,990 | 15,285 | 16,700 |
| Apprenticeship or trades certificate or diplomaNational Household Survey data footnote 73 | 7,005 | 4,655 | 2,350 |
| College, CEGEP or other non-university certificate or diploma | 13,550 | 5,950 | 7,605 |
| University certificate or diploma below bachelor levelNational Household Survey data footnote 74 | 1,650 | 585 | 1,060 |
| University certificate, diploma or degree at bachelor level or above | 9,780 | 4,100 | 5,685 |
| Bachelor's degree | 6,895 | 2,620 | 4,275 |
| University certificate, diploma or degree above bachelor levelNational Household Survey data footnote 75 | 2,890 | 1,485 | 1,410 |
| Total population aged 25 to 64 years by highest certificate, diploma or degreeNational Household Survey data footnote 70 | 46,080 | 22,715 | 23,365 |
| No certificate, diploma or degree | 9,105 | 4,970 | 4,130 |
| High school diploma or equivalentNational Household Survey data footnote 71 | 11,020 | 5,735 | 5,285 |
| Postsecondary certificate, diploma or degreeNational Household Survey data footnote 72 | 25,955 | 12,005 | 13,950 |
| Apprenticeship or trades certificate or diplomaNational Household Survey data footnote 73 | 5,145 | 3,380 | 1,765 |
| College, CEGEP or other non-university certificate or diploma | 11,260 | 4,910 | 6,350 |
| University certificate or diploma below bachelor levelNational Household Survey data footnote 74 | 1,245 | 425 | 815 |
| University certificate, diploma or degree at bachelor level or above | 8,300 | 3,285 | 5,010 |
| Bachelor's degree | 5,930 | 2,205 | 3,730 |
| University certificate, diploma or degree above bachelor levelNational Household Survey data footnote 75 | 2,370 | 1,085 | 1,285 |
| Total population aged 15 years and over by major field of study - Classification of Instructional Programs (CIP) 2011National Household Survey data footnote 76 | 66,495 | 32,855 | 33,640 |
| No postsecondary certificate, diploma or degreeNational Household Survey data footnote 77 | 34,505 | 17,570 | 16,935 |
| Education | 2,800 | 790 | 2,015 |
| Visual and performing arts, and communications technologies | 565 | 215 | 355 |
| Humanities | 1,185 | 435 | 755 |
| Social and behavioural sciences and law | 1,780 | 445 | 1,340 |
| Business, management and public administration | 8,215 | 2,520 | 5,700 |
| Physical and life sciences and technologies | 710 | 355 | 355 |
| Mathematics, computer and information sciences | 1,030 | 650 | 380 |
| Architecture, engineering, and related technologies | 7,465 | 7,150 | 315 |
| Agriculture, natural resources and conservation | 575 | 330 | 245 |
| Health and related fieldsNational Household Survey data footnote 78 | 4,700 | 790 | 3,900 |
| Personal, protective and transportation services | 2,940 | 1,610 | 1,330 |
| Other fields of studyNational Household Survey data footnote 79 | 0 | 0 | 0 |
| Total population aged 15 years and over by location of study compared with province or territory of residenceNational Household Survey data footnote 80 | 66,495 | 32,855 | 33,635 |
| No postsecondary certificate, diploma or degree | 34,505 | 17,570 | 16,935 |
| With postsecondary certificate, diploma or degree | 31,990 | 15,285 | 16,705 |
| Location of study inside Canada | 30,970 | 14,705 | 16,265 |
| Same as province or territory of residence | 24,925 | 11,480 | 13,440 |
| Another province or territory | 6,045 | 3,220 | 2,820 |
| Location of study outside Canada | 1,015 | 585 | 440 |
| Language used most often at work | |||
| Total population aged 15 years and over by language used most often at workNational Household Survey data footnote 81 | 47,800 | 25,040 | 22,755 |
| Single responses | 44,190 | 23,040 | 21,150 |
| English | 24,335 | 13,790 | 10,545 |
| French | 19,845 | 9,240 | 10,605 |
| Non-official languages | 10 | 0 | 0 |
| Chinese, n.o.s. | 0 | 0 | 0 |
| Cantonese | 0 | 0 | 0 |
| Panjabi (Punjabi) | 0 | 0 | 0 |
| Mandarin | 0 | 0 | 0 |
| Spanish | 0 | 0 | 0 |
| Korean | 0 | 0 | 0 |
| German | 0 | 0 | 0 |
| Cree languagesNational Household Survey data footnote 82 | 0 | 0 | 0 |
| Portuguese | 0 | 0 | 0 |
| Inuktitut | 0 | 0 | 0 |
| Other languages | 0 | 0 | 0 |
| Multiple responses | 3,605 | 2,000 | 1,605 |
| English and French | 3,555 | 1,965 | 1,590 |
| English and non-official language | 35 | 0 | 0 |
| French and non-official language | 0 | 0 | 0 |
| English, French and non-official language | 0 | 0 | 0 |
| Total population aged 15 years and over by language used most often at workNational Household Survey data footnote 81 | 47,800 | 25,045 | 22,755 |
| English | 24,335 | 13,795 | 10,545 |
| French | 19,845 | 9,245 | 10,605 |
| Non-official language | 10 | 0 | 0 |
| Aboriginal | 0 | 0 | 0 |
| Non-Aboriginal | 0 | 0 | 0 |
| English and French | 3,555 | 1,970 | 1,585 |
| English and non-official language | 35 | 0 | 0 |
| French and non-official language | 0 | 0 | 0 |
| English, French and non-official language | 0 | 0 | 0 |
| Labour force status | |||
| Total population aged 15 years and over by labour force statusNational Household Survey data footnote 83 | 66,490 | 32,855 | 33,635 |
| In the labour force | 44,235 | 23,150 | 21,085 |
| Employed | 39,035 | 19,880 | 19,155 |
| Unemployed | 5,200 | 3,265 | 1,935 |
| Not in the labour force | 22,260 | 9,710 | 12,550 |
| Participation rate | 66.5 | 70.5 | 62.7 |
| Employment rate | 58.7 | 60.5 | 56.9 |
| Unemployment rate | 11.8 | 14.1 | 9.2 |
| Class of worker | |||
| Total labour force aged 15 years and over by class of workerNational Household Survey data footnote 84 | 44,235 | 23,145 | 21,090 |
| Class of worker - not applicableNational Household Survey data footnote 85 | 475 | 195 | 280 |
| All classes of workerNational Household Survey data footnote 86 | 43,760 | 22,950 | 20,805 |
| Employee | 40,180 | 20,580 | 19,605 |
| Self-employedNational Household Survey data footnote 87 | 3,575 | 2,375 | 1,205 |
| Occupation | |||
| Total labour force population aged 15 years and over by occupation - National Occupational Classification (NOC) 2011National Household Survey data footnote 88 | 44,235 | 23,145 | 21,090 |
| Occupation - not applicableNational Household Survey data footnote 89 | 475 | 195 | 280 |
| All occupationsNational Household Survey data footnote 86 | 43,760 | 22,950 | 20,810 |
| 0 Management occupations | 3,890 | 2,225 | 1,665 |
| 1 Business, finance and administration occupations | 6,840 | 1,510 | 5,330 |
| 2 Natural and applied sciences and related occupations | 2,215 | 1,675 | 540 |
| 3 Health occupations | 2,960 | 475 | 2,485 |
| 4 Occupations in education, law and social, community and government services | 4,750 | 1,320 | 3,425 |
| 5 Occupations in art, culture, recreation and sport | 740 | 280 | 455 |
| 6 Sales and service occupations | 9,035 | 3,675 | 5,360 |
| 7 Trades, transport and equipment operators and related occupations | 8,965 | 8,635 | 330 |
| 8 Natural resources, agriculture and related production occupations | 1,465 | 1,310 | 155 |
| 9 Occupations in manufacturing and utilities | 2,905 | 1,845 | 1,065 |
| Industry | |||
| Total labour force population aged 15 years and over by industry - North American Industry Classification System (NAICS) 2007National Household Survey data footnote 90 | 44,235 | 23,150 | 21,090 |
| Industry - not applicableNational Household Survey data footnote 89 | 480 | 195 | 285 |
| All industriesNational Household Survey data footnote 86 | 43,760 | 22,950 | 20,805 |
| 11 Agriculture, forestry, fishing and hunting | 1,285 | 970 | 315 |
| 21 Mining, quarrying, and oil and gas extraction | 385 | 310 | 80 |
| 22 Utilities | 115 | 95 | 15 |
| 23 Construction | 4,255 | 3,895 | 355 |
| 31-33 Manufacturing | 5,255 | 3,555 | 1,695 |
| 41 Wholesale trade | 1,865 | 1,395 | 465 |
| 44-45 Retail trade | 4,520 | 2,310 | 2,210 |
| 48-49 Transportation and warehousing | 2,430 | 1,795 | 630 |
| 51 Information and cultural industries | 635 | 310 | 325 |
| 52 Finance and insurance | 2,095 | 530 | 1,570 |
| 53 Real estate and rental and leasing | 375 | 200 | 170 |
| 54 Professional, scientific and technical services | 1,515 | 730 | 785 |
| 55 Management of companies and enterprises | 10 | 0 | 0 |
| 56 Administrative and support, waste management and remediation services | 1,575 | 940 | 640 |
| 61 Educational services | 3,155 | 925 | 2,230 |
| 62 Health care and social assistance | 5,120 | 810 | 4,305 |
| 71 Arts, entertainment and recreation | 755 | 400 | 355 |
| 72 Accommodation and food services | 2,155 | 650 | 1,505 |
| 81 Other services (except public administration) | 1,825 | 1,130 | 690 |
| 91 Public administration | 4,440 | 2,000 | 2,440 |
| Work activity | |||
| Total labour force aged 15 years and over by work activity in 2010National Household Survey data footnote 91 | 44,235 | 23,145 | 21,090 |
| Did not work in 2010National Household Survey data footnote 92 | 1,325 | 450 | 870 |
| Worked in 2010 | 42,915 | 22,695 | 20,220 |
| 1 to 13 weeks | 2,020 | 1,010 | 1,010 |
| 14 to 26 weeks | 5,650 | 3,365 | 2,280 |
| 27 to 39 weeks | 2,980 | 1,455 | 1,520 |
| 40 to 48 weeks | 5,390 | 2,940 | 2,455 |
| 49 to 52 weeks | 26,875 | 13,925 | 12,950 |
| Average weeks worked in 2010 | 43.1 | 42.7 | 43.6 |
| Full-time or part-time weeks worked | |||
| Total labour force population aged 15 years and over by full-time or part-time weeks worked in 2010National Household Survey data footnote 93 | 44,235 | 23,150 | 21,085 |
| Did not work in 2010National Household Survey data footnote 92 | 1,320 | 455 | 865 |
| Worked in 2010 | 42,915 | 22,695 | 20,220 |
| Worked full-time in 2010 | 36,600 | 20,385 | 16,205 |
| Worked part-time in 2010 | 6,320 | 2,305 | 4,010 |
| Place of work status | |||
| Total employed population aged 15 years and over by place of work statusNational Household Survey data footnote 94 | 39,035 | 19,880 | 19,155 |
| Worked at home | 2,180 | 1,165 | 1,015 |
| Worked outside Canada | 70 | 50 | 25 |
| No fixed workplace address | 5,200 | 4,110 | 1,085 |
| Worked at usual place | 31,585 | 14,555 | 17,030 |
| Mode of transportation | |||
| Total employed population aged 15 years and over with a usual place of work or no fixed workplace address by mode of transportationNational Household Survey data footnote 95 | 36,780 | 18,665 | 18,115 |
| Car, truck or van - as a driver | 31,115 | 16,200 | 14,915 |
| Car, truck or van - as a passenger | 3,200 | 1,265 | 1,935 |
| Public transit | 210 | 125 | 95 |
| Walked | 1,760 | 740 | 1,020 |
| Bicycle | 160 | 135 | 25 |
| Other methods | 335 | 205 | 130 |
| Median commuting duration | |||
| Total employed population aged 15 years and over with a usual place of work or no fixed workplace address by median commuting durationNational Household Survey data footnote 96 | 36,780 | 18,665 | 18,110 |
| Median commuting duration | 20.1 | 20.2 | 16.0 |
| Time leaving for work | |||
| Total employed population aged 15 years and over by time leaving for workNational Household Survey data footnote 97 | 36,780 | 18,665 | 18,115 |
| Between 5 and 6:59 a.m. | 8,655 | 5,540 | 3,115 |
| Between 7 and 9:00 a.m. | 22,565 | 10,280 | 12,285 |
| Anytime after 9:00 a.m. | 5,560 | 2,845 | 2,715 |
| Occupied private dwelling characteristics | |||
| Total number of occupied private dwellings by condition of dwellingNational Household Survey data footnote 98 | 32,560 | ... | ... |
| Only regular maintenance or minor repairs needed | 29,730 | ... | ... |
| Major repairs needed | 2,830 | ... | ... |
| Total number of occupied private dwellings by period of constructionNational Household Survey data footnote 99 | 32,560 | ... | ... |
| 1960 or before | 7,355 | ... | ... |
| 1961 to 1980 | 8,985 | ... | ... |
| 1981 to 1990 | 4,990 | ... | ... |
| 1991 to 2000 | 4,190 | ... | ... |
| 2001 to 2005 | 3,505 | ... | ... |
| 2006 to 2011National Household Survey data footnote 100 | 3,535 | ... | ... |
| Total number of occupied private dwellings by number of roomsNational Household Survey data footnote 101 | 32,560 | ... | ... |
| 1 to 4 rooms | 5,580 | ... | ... |
| 5 rooms | 5,860 | ... | ... |
| 6 rooms | 6,050 | ... | ... |
| 7 rooms | 5,000 | ... | ... |
| 8 or more rooms | 10,075 | ... | ... |
| Average number of rooms per dwelling | 6.6 | ... | ... |
| Total number of occupied private dwellings by number of bedroomsNational Household Survey data footnote 102 | 32,565 | ... | ... |
| 0 to 1 bedroom | 2,090 | ... | ... |
| 2 bedrooms | 8,640 | ... | ... |
| 3 bedrooms | 14,035 | ... | ... |
| 4 or more bedrooms | 7,800 | ... | ... |
| Household characteristics | |||
| Total number of private households by tenureNational Household Survey data footnote 103 | 32,560 | ... | ... |
| Owner | 27,370 | ... | ... |
| Renter | 5,100 | ... | ... |
| Band housing | 90 | ... | ... |
| Total number of private households by condominium statusNational Household Survey data footnote 104 | 32,560 | ... | ... |
| Part of a condominium development | 780 | ... | ... |
| Not part of a condominium development | 31,785 | ... | ... |
| Total number of private households by number of household maintainersNational Household Survey data footnote 105 | 32,560 | ... | ... |
| 1 household maintainer | 17,020 | ... | ... |
| 2 household maintainers | 15,005 | ... | ... |
| 3 or more household maintainers | 540 | ... | ... |
| Total number of private households by age group of primary household maintainersNational Household Survey data footnote 106 | 32,560 | ... | ... |
| Under 25 years | 850 | ... | ... |
| 25 to 34 years | 4,040 | ... | ... |
| 35 to 44 years | 5,410 | ... | ... |
| 45 to 54 years | 7,185 | ... | ... |
| 55 to 64 years | 7,255 | ... | ... |
| 65 to 74 years | 4,625 | ... | ... |
| 75 years and over | 3,200 | ... | ... |
| Total number of private households by number of persons per roomNational Household Survey data footnote 107 | 32,565 | ... | ... |
| One person or fewer per room | 32,405 | ... | ... |
| More than one person per room | 155 | ... | ... |
| Total number of private households by housing suitabilityNational Household Survey data footnote 108 | 32,560 | ... | ... |
| Suitable | 31,725 | ... | ... |
| Not suitable | 835 | ... | ... |
| Shelter costs | |||
| Total number of owner and tenant households with household total income greater than zero, in non-farm, non-reserve private dwellings by shelter-cost-to-income ratioNational Household Survey data footnote 109 | 32,200 | ... | ... |
| Spending less than 30% of household total income on shelter costs | 27,395 | ... | ... |
| Spending 30% or more of household total income on shelter costs | 4,805 | ... | ... |
| Spending 30% to less than 100% of household total income on shelter costs | 4,010 | ... | ... |
| Number of owner households in non-farm, non-reserve private dwellings | 27,155 | ... | ... |
| % of owner households with a mortgageNational Household Survey data footnote 110 | 59.0 | ... | ... |
| % of owner households spending 30% or more of household total income on shelter costsNational Household Survey data footnote 111 | 11.0 | ... | ... |
| Median monthly shelter costs for owned dwellings ($)National Household Survey data footnote 112 | 722 | ... | ... |
| Average monthly shelter costs for owned dwellings ($)National Household Survey data footnote 112 | 826 | ... | ... |
| Median value of dwellings ($)National Household Survey data footnote 113 | 149,569 | ... | ... |
| Average value of dwellings ($)National Household Survey data footnote 113 | 165,493 | ... | ... |
| Number of tenant households in non-farm, non-reserve private dwellings | 5,095 | ... | ... |
| % of tenant households in subsidized housingNational Household Survey data footnote 114 | 17.5 | ... | ... |
| % of tenant households spending 30% or more of household total income on shelter costsNational Household Survey data footnote 115 | 35.8 | ... | ... |
| Median monthly shelter costs for rented dwellings ($)National Household Survey data footnote 116 | 633 | ... | ... |
| Average monthly shelter costs for rented dwellings ($)National Household Survey data footnote 116 | 650 | ... | ... |
| Income of individuals in 2010 | |||
| Total income in 2010 of population aged 15 years and overNational Household Survey data footnote 117 | 66,495 | 32,855 | 33,640 |
| Without income | 2,275 | 915 | 1,360 |
| With income | 64,220 | 31,945 | 32,280 |
| Under $5,000National Household Survey data footnote 118 | 4,410 | 1,985 | 2,430 |
| $5,000 to $9,999 | 5,245 | 1,780 | 3,460 |
| $10,000 to $14,999 | 5,415 | 1,725 | 3,695 |
| $15,000 to $19,999 | 7,065 | 2,870 | 4,190 |
| $20,000 to $29,999 | 11,465 | 5,635 | 5,830 |
| $30,000 to $39,999 | 9,935 | 5,345 | 4,590 |
| $40,000 to $49,999 | 7,440 | 4,480 | 2,965 |
| $50,000 to $59,999 | 4,440 | 2,885 | 1,550 |
| $60,000 to $79,999 | 5,125 | 2,680 | 2,445 |
| $80,000 to $99,999 | 1,950 | 1,245 | 710 |
| $100,000 and over | 1,725 | 1,320 | 405 |
| $100,000 to $124,999 | 895 | 655 | 240 |
| $125,000 and over | 830 | 665 | 165 |
| Median income ($)National Household Survey data footnote 119 | 28,740 | 33,672 | 23,695 |
| Average income ($)National Household Survey data footnote 119 | 34,830 | 40,017 | 29,697 |
| After-tax income in 2010 of population 15 years and overNational Household Survey data footnote 120 | 66,490 | 32,855 | 33,635 |
| Without after-tax income | 2,295 | 915 | 1,375 |
| With after-tax income | 64,200 | 31,940 | 32,265 |
| Under $5,000National Household Survey data footnote 121 | 4,585 | 1,995 | 2,590 |
| $5,000 to $9,999 | 5,280 | 1,810 | 3,470 |
| $10,000 to $14,999 | 5,675 | 1,795 | 3,880 |
| $15,000 to $19,999 | 7,885 | 3,360 | 4,530 |
| $20,000 to $29,999 | 14,190 | 7,250 | 6,940 |
| $30,000 to $39,999 | 11,230 | 6,410 | 4,820 |
| $40,000 to $49,999 | 6,645 | 4,030 | 2,615 |
| $50,000 to $59,999 | 3,940 | 2,195 | 1,750 |
| $60,000 to $79,999 | 3,175 | 1,865 | 1,315 |
| $80,000 to $99,999 | 885 | 670 | 220 |
| $100,000 and over | 705 | 575 | 140 |
| Median after-tax income ($)National Household Survey data footnote 122 | 25,868 | 29,545 | 21,793 |
| Average after-tax income ($)National Household Survey data footnote 122 | 29,743 | 33,713 | 25,812 |
| Composition of total income in 2010 of population 15 years and over (%)National Household Survey data footnote 123 | 100.0 | 100.0 | 100.0 |
| Market income (%)National Household Survey data footnote 124 | 84.0 | 86.2 | 81.1 |
| Employment income (%)National Household Survey data footnote 125 | 72.3 | 73.4 | 71.0 |
| Wages and salaries (%)National Household Survey data footnote 126 | 69.0 | 69.1 | 68.9 |
| Self-employment income (%)National Household Survey data footnote 127 | 3.3 | 4.3 | 2.0 |
| Investment income (%)National Household Survey data footnote 128 | 2.6 | 2.6 | 2.6 |
| Retirement pensions, superannuation and annuities (%)National Household Survey data footnote 129 | 7.7 | 9.1 | 5.9 |
| Other money income (%)National Household Survey data footnote 130 | 1.3 | 1.2 | 1.6 |
| Government transfer payments (%)National Household Survey data footnote 131 | 16.0 | 13.8 | 18.9 |
| Canada/Quebec Pension Plan benefits (%)National Household Survey data footnote 132 | 4.3 | 4.1 | 4.5 |
| Old Age Security pensions and Guaranteed Income Supplement (%)National Household Survey data footnote 133 | 4.4 | 3.3 | 5.9 |
| Employment Insurance benefits (%)National Household Survey data footnote 134 | 4.8 | 5.0 | 4.5 |
| Child benefits (%)National Household Survey data footnote 135 | 1.2 | 0.1 | 2.6 |
| Other income from government sources (%)National Household Survey data footnote 136 | 1.4 | 1.3 | 1.4 |
| Income taxes paid as a % of total incomeNational Household Survey data footnote 137 | 14.6 | 15.8 | 13.1 |
| After-tax income as a % of total incomeNational Household Survey data footnote 138 | 85.4 | 84.2 | 86.9 |
| Net capital gains or losses as a % of total incomeNational Household Survey data footnote 139 | 0.8 | 0.9 | 0.6 |
| Population aged 15 years and over who worked full year, full time and with employment income in 2010National Household Survey data footnote 140 | 24,315 | 12,760 | 11,555 |
| Median employment income in 2010 ($) | 41,589 | 45,382 | 37,085 |
| Average employment income in 2010 ($) | 47,535 | 52,105 | 42,488 |
| Family income in 2010 of economic familiesNational Household Survey data footnote 141 | 24,690 | ... | ... |
| Median family income ($) | 68,823 | ... | ... |
| Average family income ($) | 78,804 | ... | ... |
| Median after-tax family income ($) | 60,520 | ... | ... |
| Average after-tax family income ($) | 67,112 | ... | ... |
| Average family size | 2.8 | ... | ... |
| Couple-only economic familiesNational Household Survey data footnote 142 | 11,465 | ... | ... |
| Median family income ($) | 59,907 | ... | ... |
| Average family income ($) | 67,444 | ... | ... |
| Median after-tax family income ($) | 52,235 | ... | ... |
| Average after-tax family income ($) | 57,732 | ... | ... |
| Average family size | 2.0 | ... | ... |
| Couple-with-children economic familiesNational Household Survey data footnote 143 | 9,795 | ... | ... |
| Median family income ($) | 90,858 | ... | ... |
| Average family income ($) | 101,312 | ... | ... |
| Median after-tax family income ($) | 78,615 | ... | ... |
| Average after-tax family income ($) | 85,151 | ... | ... |
| Average family size | 3.7 | ... | ... |
| Lone-parent economic familiesNational Household Survey data footnote 144 | 2,605 | ... | ... |
| Median family income ($) | 41,205 | ... | ... |
| Average family income ($) | 45,445 | ... | ... |
| Median after-tax family income ($) | 38,211 | ... | ... |
| Average after-tax family income ($) | 41,030 | ... | ... |
| Average family size | 2.5 | ... | ... |
| Income in 2010 of population aged 15 years and over not in economic familiesNational Household Survey data footnote 145 | 9,465 | 4,580 | 4,890 |
| Median total income ($)National Household Survey data footnote 146 | 24,984 | 28,461 | 21,370 |
| Average total income ($)National Household Survey data footnote 146 | 30,746 | 33,629 | 28,044 |
| Median after-tax income ($)National Household Survey data footnote 147 | 22,802 | 25,658 | 20,804 |
| Average after-tax income ($)National Household Survey data footnote 147 | 26,674 | 28,684 | 24,790 |
| Total population by decile of adjusted after-tax family incomeNational Household Survey data footnote 148 | 77,985 | 38,800 | 39,185 |
| In bottom half of the Canadian distribution | 42,175 | 20,505 | 21,675 |
| In bottom decile | 5,075 | 2,450 | 2,630 |
| In second decile | 9,375 | 4,145 | 5,230 |
| In third decile | 8,230 | 4,125 | 4,100 |
| In fourth decile | 9,270 | 4,585 | 4,685 |
| In fifth decile | 10,230 | 5,205 | 5,025 |
| In top half of the Canadian distribution | 35,805 | 18,295 | 17,510 |
| In sixth decile | 9,300 | 4,710 | 4,595 |
| In seventh decile | 8,565 | 4,245 | 4,320 |
| In eighth decile | 7,500 | 3,915 | 3,585 |
| In ninth decile | 6,495 | 3,280 | 3,215 |
| In top decile | 3,940 | 2,145 | 1,795 |
| Income of households in 2010 | |||
| Household total income in 2010 of private householdsNational Household Survey data footnote 149 | 32,560 | ... | ... |
| Under $5,000 | 675 | ... | ... |
| $5,000 to $9,999 | 445 | ... | ... |
| $10,000 to $14,999 | 665 | ... | ... |
| $15,000 to $19,999 | 1,910 | ... | ... |
| $20,000 to $29,999 | 3,355 | ... | ... |
| $30,000 to $39,999 | 3,505 | ... | ... |
| $40,000 to $49,999 | 3,125 | ... | ... |
| $50,000 to $59,999 | 2,990 | ... | ... |
| $60,000 to $79,999 | 5,420 | ... | ... |
| $80,000 to $99,999 | 4,090 | ... | ... |
| $100,000 to $124,999 | 2,935 | ... | ... |
| $125,000 to $149,999 | 1,620 | ... | ... |
| $150,000 and over | 1,840 | ... | ... |
| After-tax income of households in 2010 of private householdsNational Household Survey data footnote 150 | 32,560 | ... | ... |
| Under $5,000 | 670 | ... | ... |
| $5,000 to $9,999 | 450 | ... | ... |
| $10,000 to $14,999 | 720 | ... | ... |
| $15,000 to $19,999 | 2,030 | ... | ... |
| $20,000 to $29,999 | 3,850 | ... | ... |
| $30,000 to $39,999 | 3,945 | ... | ... |
| $40,000 to $49,999 | 3,995 | ... | ... |
| $50,000 to $59,999 | 3,565 | ... | ... |
| $60,000 to $79,999 | 5,975 | ... | ... |
| $80,000 to $99,999 | 3,545 | ... | ... |
| $100,000 and over | 3,820 | ... | ... |
| $100,000 to $124,999 | 2,150 | ... | ... |
| $125,000 and over | 1,670 | ... | ... |
| Household income in 2010 of private householdsNational Household Survey data footnote 151 | 32,560 | ... | ... |
| Median household total income ($) | 58,628 | ... | ... |
| Average household total income ($) | 68,694 | ... | ... |
| Median after-tax household income ($) | 51,621 | ... | ... |
| Average after-tax household income ($) | 58,644 | ... | ... |
| One-person private householdsNational Household Survey data footnote 152 | 7,040 | ... | ... |
| Median household total income ($) | 25,668 | ... | ... |
| Average household total income ($) | 32,191 | ... | ... |
| Median after-tax household income ($) | 23,411 | ... | ... |
| Average after-tax household income ($) | 27,846 | ... | ... |
| Two-or-more-persons private householdsNational Household Survey data footnote 152 | 25,525 | ... | ... |
| Median household total income ($) | 68,685 | ... | ... |
| Average household total income ($) | 78,761 | ... | ... |
| Median after-tax household income ($) | 60,581 | ... | ... |
| Average after-tax household income ($) | 67,138 | ... | ... |
| Income of individuals in 2010 | |||
| Population in private households for income statusNational Household Survey data footnote 153 | 77,730 | 38,675 | 39,055 |
| Less than 18 years | 14,015 | 7,360 | 6,655 |
| Less than 6 years | 4,440 | 2,340 | 2,095 |
| 18 to 64 years | 51,570 | 25,535 | 26,030 |
| 65 years and over | 12,150 | 5,780 | 6,370 |
| In low income in 2010 based on after-tax low-income measure (LIM-AT) | 10,330 | 4,680 | 5,655 |
| Less than 18 years | 2,050 | 1,105 | 945 |
| Less than 6 years | 640 | 375 | 260 |
| 18 to 64 years | 5,655 | 2,590 | 3,070 |
| 65 years and over | 2,630 | 985 | 1,640 |
| Prevalence of low income in 2010 based on after-tax low-income measure (%) | 13.3 | 12.1 | 14.5 |
| Less than 18 years (%) | 14.6 | 15.0 | 14.2 |
| Less than 6 years (%) | 14.4 | 16.0 | 12.4 |
| 18 to 64 years (%) | 11.0 | 10.1 | 11.8 |
| 65 years and over (%) | 21.6 | 17.0 | 25.7 |
Symbols
... not applicable
National Household Survey data: Footnotes
- Footnote 1
-
Citizenship refers to the legal citizenship status of a person. Citizenship can be by birth or naturalization. A person may have more than one citizenship. A person may be stateless, that is, they may have no citizenship.
Return to National Household Survey data footnote 1 referrer
- Footnote 2
-
Includes persons who are stateless.
Return to National Household Survey data footnote 2 referrer
- Footnote 3
-
Period of immigration refers to the period in which the immigrant first obtained his or her landed immigrant/permanent resident status. A landed immigrant/permanent resident refers to a person who has been granted the right to live permanently in Canada by immigration authorities.
Return to National Household Survey data footnote 3 referrer
- Footnote 4
-
Non-immigrant refers to a person who is a Canadian citizen by birth.
Return to National Household Survey data footnote 4 referrer
- Footnote 5
-
Immigrant refers to a person who is or has ever been a landed immigrant/permanent resident. This person has been granted the right to live in Canada permanently by immigration authorities. Some immigrants have resided in Canada for a number of years, while others have arrived recently. Some immigrants are Canadian citizens, while others are not. Most immigrants are born outside Canada, but a small number are born in Canada. In the 2011 National Household Survey, 'Immigrants' includes immigrants who landed in Canada prior to May 10, 2011.
Return to National Household Survey data footnote 5 referrer
- Footnote 6
-
Includes immigrants who landed in Canada prior to May 10, 2011.
Return to National Household Survey data footnote 6 referrer
- Footnote 7
-
Non-permanent resident refers to a person from another country who has a work or study permit, or who is a refugee claimant, and any non-Canadian-born family member living in Canada with them.
Return to National Household Survey data footnote 7 referrer
- Footnote 8
-
Age at immigration refers to the age at which an immigrant first obtained landed immigrant/permanent resident status. Immigrant refers to a person who is or has ever been a landed immigrant/permanent resident. This person has been granted the right to live permanently in Canada by immigration authorities.
Return to National Household Survey data footnote 8 referrer
- Footnote 9
-
The places of birth selected are the most frequently reported by immigrants at the Canada level.
Return to National Household Survey data footnote 9 referrer
- Footnote 10
-
Non-immigrant refers to a person who is a Canadian citizen by birth.
Return to National Household Survey data footnote 10 referrer
- Footnote 11
-
Immigrant refers to a person who is or has ever been a landed immigrant/permanent resident. This person has been granted the right to live in Canada permanently by immigration authorities. Some immigrants have resided in Canada for a number of years, while others have arrived recently. Some immigrants are Canadian citizens, while others are not. Most immigrants are born outside Canada, but a small number are born in Canada. In the 2011 National Household Survey, 'Immigrants' includes immigrants who landed in Canada prior to May 10, 2011.
Return to National Household Survey data footnote 11 referrer
- Footnote 12
-
The official name of United Kingdom is United Kingdom of Great Britain and Northern Ireland. United Kingdom includes Scotland, Wales, England and Northern Ireland (excludes Isle of Man, the Channel Islands and British Overseas Territories).
Return to National Household Survey data footnote 12 referrer
- Footnote 13
-
China excludes Hong Kong Special Administrative Region and Macao Special Administrative Region.
Return to National Household Survey data footnote 13 referrer
- Footnote 14
-
The official name of Viet Nam is Socialist Republic of Viet Nam.
Return to National Household Survey data footnote 14 referrer
- Footnote 15
-
The official name of Iran is Islamic Republic of Iran.
Return to National Household Survey data footnote 15 referrer
- Footnote 16
-
The official name of South Korea is Republic of Korea.
Return to National Household Survey data footnote 16 referrer
- Footnote 17
-
The category 'Oceania and other' includes places of birth in Oceania and responses not included elsewhere, such as 'born at sea.'
Return to National Household Survey data footnote 17 referrer
- Footnote 18
-
The category 'Other places of birth' includes other places of birth in Oceania and responses not included elsewhere, such as 'born at sea.'
Return to National Household Survey data footnote 18 referrer
- Footnote 19
-
Non-permanent resident refers to a person from another country who has a work or study permit, or who is a refugee claimant, and any non-Canadian-born family member living in Canada with them.
Return to National Household Survey data footnote 19 referrer
- Footnote 20
-
Recent immigrants are immigrants who landed in Canada between January 1, 2006 and May 10, 2011. Immigrant refers to a person who is or has ever been a landed immigrant/permanent resident. This person has been granted the right to live in Canada permanently by immigration authorities. Some immigrants have resided in Canada for a number of years, while others have arrived recently. Some immigrants are Canadian citizens, while others are not. Most immigrants are born outside Canada, but a small number are born in Canada. The places of birth selected are the most frequently reported by recent immigrants at the Canada level.
Return to National Household Survey data footnote 20 referrer
- Footnote 21
-
The official name of Venezuela is Bolivarian Republic of Venezuela.
Return to National Household Survey data footnote 21 referrer
- Footnote 22
-
The official name of Moldova is Republic of Moldova.
Return to National Household Survey data footnote 22 referrer
- Footnote 23
-
The official name of Syria is Syrian Arab Republic.
Return to National Household Survey data footnote 23 referrer
- Footnote 24
-
Generation status refers to whether or not the person or the person's parents were born in Canada. It identifies persons as being first generation, second generation or third generation or more.
Return to National Household Survey data footnote 24 referrer
- Footnote 25
-
'First generation' includes persons who were born outside Canada. For the most part, these are people who are now, or have ever been, immigrants to Canada.
Return to National Household Survey data footnote 25 referrer
- Footnote 26
-
'Second generation' includes persons who were born in Canada and had at least one parent born outside Canada. For the most part, these are the children of immigrants.
Return to National Household Survey data footnote 26 referrer
- Footnote 27
-
'Third generation or more' includes persons who were born in Canada with both parents born in Canada.
Return to National Household Survey data footnote 27 referrer
- Footnote 28
-
The Employment Equity Act defines visible minorities as 'persons, other than Aboriginal peoples, who are non-Caucasian in race or non-white in colour.'
Return to National Household Survey data footnote 28 referrer
- Footnote 29
-
For example, 'East Indian,' 'Pakistani,' 'Sri Lankan,' etc.
Return to National Household Survey data footnote 29 referrer
- Footnote 30
-
For example, 'Vietnamese,' 'Cambodian,' 'Malaysian,' 'Laotian,' etc.
Return to National Household Survey data footnote 30 referrer
- Footnote 31
-
For example, 'Iranian,' 'Afghan,' etc.
Return to National Household Survey data footnote 31 referrer
- Footnote 32
-
The abbreviation 'n.i.e.' means 'not included elsewhere.' Includes respondents who reported a write-in response such as 'Guyanese,' 'West Indian,' 'Tibetan,' 'Polynesian,' 'Pacific Islander,' etc.
Return to National Household Survey data footnote 32 referrer
- Footnote 33
-
Includes respondents who reported more than one visible minority group by checking two or more mark-in circles, e.g., 'Black' and 'South Asian.'
Return to National Household Survey data footnote 33 referrer
- Footnote 34
-
Includes respondents who reported 'Yes' to the Aboriginal identity question (Question 18) as well as respondents who were not considered to be members of a visible minority group.
Return to National Household Survey data footnote 34 referrer
- Footnote 35
-
This is a total population estimate. The sum of the ethnic groups in this table is greater than the total population estimate because a person may report more than one ethnic origin in the NHS.
Return to National Household Survey data footnote 35 referrer
- Footnote 36
-
Includes general responses indicating North American origins (e.g., 'North American') as well as more specific responses indicating North American origins that have not been included elsewhere (e.g., 'Maritimer,' 'Manitoban').
Return to National Household Survey data footnote 36 referrer
- Footnote 37
-
Includes general responses indicating British Isles origins (e.g., 'British,' 'United Kingdom') as well as more specific responses indicating British Isles origins that have not been included elsewhere (e.g., 'Celtic').
Return to National Household Survey data footnote 37 referrer
- Footnote 38
-
Includes general responses indicating Western European origins (e.g., 'Western European') as well as more specific responses indicating Western European origins that have not been included elsewhere (e.g., 'Liechtensteiner').
Return to National Household Survey data footnote 38 referrer
- Footnote 39
-
Includes general responses indicating Northern European origins (e.g., 'Northern European') as well as more specific responses indicating Northern European origins that have not been included elsewhere (e.g., 'Faroese,' 'Scandinavian').
Return to National Household Survey data footnote 39 referrer
- Footnote 40
-
Includes general responses indicating Eastern European origins (e.g., 'Eastern European') as well as more specific responses indicating Eastern European origins that have not been included elsewhere (e.g., 'Baltic').
Return to National Household Survey data footnote 40 referrer
- Footnote 41
-
Includes general responses indicating Southern European origins (e.g., 'Southern European') as well as more specific responses indicating Southern European origins that have not been included elsewhere (e.g., 'Gibraltarian').
Return to National Household Survey data footnote 41 referrer
- Footnote 42
-
Includes general responses indicating Other European origins (e.g., 'European') as well as more specific responses indicating European origins that have not been included elsewhere (e.g., 'Central European').
Return to National Household Survey data footnote 42 referrer
- Footnote 43
-
Includes general responses indicating Caribbean origins (e.g., 'Caribbean') as well as more specific responses indicating Caribbean origins that have not been included elsewhere (e.g., 'Guadelupian,' 'Aruban').
Return to National Household Survey data footnote 43 referrer
- Footnote 44
-
Includes general responses indicating Latin, Central or South American origins (e.g., 'South American') as well as more specific responses indicating Latin, Central or South American origins that have not been included elsewhere (e.g., 'Surinamese').
Return to National Household Survey data footnote 44 referrer
- Footnote 45
-
Includes general responses indicating Central or West African origins (e.g., 'West African') as well as more specific responses indicating Central or West African origins that have not been included elsewhere (e.g., 'Ewe,' 'Wolof').
Return to National Household Survey data footnote 45 referrer
- Footnote 46
-
Includes general responses indicating North African origins (e.g., 'North African') as well as more specific responses indicating North African origins that have not been included elsewhere (e.g., 'Maghreb').
Return to National Household Survey data footnote 46 referrer
- Footnote 47
-
Includes general responses indicating Southern or East African origins (e.g., 'East African') as well as more specific responses indicating Southern or East African origins that have not been included elsewhere (e.g., 'Hutu,' 'Shona').
Return to National Household Survey data footnote 47 referrer
- Footnote 48
-
Some respondents may choose to provide very specific ethnic origins in the National Household Survey (NHS), while other respondents may choose to give more general responses. This means that two respondents with the same ethnic ancestry could have different response patterns and thus could be counted as having different ethnic origins. For example, one respondent may report 'East Indian' ethnic origin while another respondent, with a similar ancestral background, may report 'Punjabi' or 'South Asian' origins; one respondent may report 'Black' while another, similar respondent, may report 'Ghanaian' or 'African.' As a result, ethnic origin data are very fluid, and counts for certain origins, such as 'East Indian' and 'Black,' may seem lower than initially expected. Users who wish to obtain broader response counts may wish to combine data for one or more ethnic origins together or use counts for ethnic categories such as 'South Asian origins' or 'African origins.' (Please note, however, that 'African origins' should not be considered equivalent to the 'Black' population group or visible minority status, as there are persons reporting African origins who report a population group or visible minority status other than 'Black.' Conversely, many people report a population group or visible minority status of 'Black' and do not report having 'African' origins. For information on population group and visible minority population in the 2011 NHS, refer to the appropriate definitions in this publication.)
Return to National Household Survey data footnote 48 referrer
- Footnote 49
-
Includes general responses indicating Other African origins (e.g., 'African') as well as more specific responses indicating Other African origins that have not been included elsewhere (e.g., 'Saharan').
Return to National Household Survey data footnote 49 referrer
- Footnote 50
-
Includes general responses indicating West Asian, Central Asian and Middle Eastern origins (e.g., 'West Asian,' 'Middle Eastern') as well as more specific responses indicating West Asian, Central Asian and Middle Eastern origins that have not been included elsewhere (e.g., 'Baloch,' 'Circassian').
Return to National Household Survey data footnote 50 referrer
- Footnote 51
-
Includes general responses indicating South Asian origins (e.g., 'South Asian') as well as more specific responses indicating South Asian origins that have not been included elsewhere (e.g., 'Bhutanese').
Return to National Household Survey data footnote 51 referrer
- Footnote 52
-
Includes general responses indicating East and Southeast Asian origins (e.g., 'Southeast Asian') as well as more specific responses indicating East and Southeast Asian origins that have not been included elsewhere (e.g., 'Bruneian,' 'Karen').
Return to National Household Survey data footnote 52 referrer
- Footnote 53
-
Includes general responses indicating Other Asian origins (e.g., 'Asian') as well as more specific responses indicating Other Asian origins that have not been included elsewhere (e.g., 'Eurasian').
Return to National Household Survey data footnote 53 referrer
- Footnote 54
-
Includes general responses indicating Pacific Islands origins (e.g., 'Pacific Islander') as well as more specific responses indicating Pacific Islands origins that have not been included elsewhere (e.g., 'Tahitian').
Return to National Household Survey data footnote 54 referrer
- Footnote 55
-
Religion refers to the person's self-identification as having a connection or affiliation with any religious denomination, group, body, sect, cult or other religiously defined community or system of belief. Religion is not limited to formal membership in a religious organization or group. Persons without a religious connection or affiliation can self-identify as atheist, agnostic or humanist, or can provide another applicable response.
Return to National Household Survey data footnote 55 referrer
- Footnote 56
-
'Aboriginal identity' includes persons who reported being an Aboriginal person, that is, First Nations (North American Indian), Métis or Inuk (Inuit) and/or those who reported Registered or Treaty Indian status, that is registered under the Indian Act of Canada, and/or those who reported membership in a First Nation or Indian band. Aboriginal peoples of Canada are defined in the Constitution Act, 1982, section 35 (2) as including the Indian, Inuit and Métis peoples of Canada.
Return to National Household Survey data footnote 56 referrer
- Footnote 57
-
Users should be aware that the estimates associated with this variable are more affected than most by the incomplete enumeration of certain Indian reserves and Indian settlements in the National Household Survey (NHS). In 2011, there were a total of 36 Indian reserves and Indian settlements that were 'incompletely enumerated' in the NHS. For these reserves or settlements, NHS enumeration was either not permitted or was interrupted before it could be completed, or was not possible because of natural events (specifically forest fires in Northern Ontario). For additional information, please refer to the Aboriginal Peoples Reference Guide, National Household Survey (NHS), 2011.
Return to National Household Survey data footnote 57 referrer
- Footnote 58
-
'Multiple Aboriginal identities' includes persons who reported being any two or all three of the following: First Nations (North American Indian), Métis or Inuk (Inuit).
Return to National Household Survey data footnote 58 referrer
- Footnote 59
-
'Aboriginal identities not included elsewhere' includes persons who did not report being First Nations (North American Indian), Métis or Inuk (Inuit) but who did report Registered or Treaty Indian status and/or membership in a First Nation or Indian band.
Return to National Household Survey data footnote 59 referrer
- Footnote 60
-
Registered or Treaty Indian status refers to whether or not a person reported being a Registered or Treaty Indian.' Registered or Treaty Indian' includes persons who reported being a Registered or Treaty Indian in Question 20. Registered Indians are persons who are registered under the Indian Act of Canada. Treaty Indians are persons who belong to a First Nation or Indian band that signed a treaty with the Crown. Registered or Treaty Indians are sometimes also called Status Indians.
Return to National Household Survey data footnote 60 referrer
- Footnote 61
-
This is a total population estimate. The sum of the ancestries in this table is greater than the total population estimate because a person may report more than one ancestry (ethnic origin) in the National Household Survey.
Return to National Household Survey data footnote 61 referrer
- Footnote 62
-
'Aboriginal ancestry' includes persons who reported one or more than one of First Nations (North American Indian), Métis or Inuit ancestry in Question 17, either with or without also reporting a non-Aboriginal ancestry. The sum of the categories 'First Nations (North American Indian) ancestry', 'Métis ancestry' and 'Inuit ancestry' is thus greater than the sum of the total for 'Aboriginal ancestry' because persons who reported more than one Aboriginal ancestry are included in the response category for each Aboriginal ancestry they reported. All respondents with Aboriginal ancestry are counted in at least one of the categories 'First Nations (North American Indian) ancestry,' 'Métis ancestry' and 'Inuit ancestry' and also in the category 'Aboriginal ancestry.' Aboriginal peoples of Canada are defined in the Constitution Act, 1982, section 35 (2) as including the Indian, Inuit and Métis peoples of Canada. Ancestry refers to the ethnic or cultural origins of the respondent's ancestors, an ancestor being usually more distant than a grandparent. A person can have more than one ethnic or cultural origin.
Return to National Household Survey data footnote 62 referrer
- Footnote 63
-
'Non-Aboriginal ancestry only' includes persons who did not report First Nations (North American Indian), Métis or Inuit ancestry in Question 17.
Return to National Household Survey data footnote 63 referrer
- Footnote 64
-
Refers to languages, other than English or French, in which the respondent can conduct a conversation. The category 'Non-official languages spoken' represents the sum of single language responses and multiple language responses received in the National Household Survey. Hence, this total is greater than the total population.
Return to National Household Survey data footnote 64 referrer
- Footnote 65
-
Cree languages include the following categories: Cree not otherwise specified (which refers to those who reported 'Cree'), Swampy Cree, Plains Cree, Woods Cree, and a category labelled 'Cree not included elsewhere' (which includes Moose Cree, Northern East Cree and Southern East Cree).
Return to National Household Survey data footnote 65 referrer
- Footnote 66
-
This is a subtotal of all Aboriginal languages collected on May 10, 2011 that are not displayed separately here.
Return to National Household Survey data footnote 66 referrer
- Footnote 67
-
This is a subtotal of all non-Aboriginal languages, other than English or French, collected on May 10, 2011 that are not displayed separately here.
Return to National Household Survey data footnote 67 referrer
- Footnote 68
-
Refers to the status of a person with regard to the place of residence on the reference day, May 10, 2011, in relation to the place of residence on the same date one year earlier. Persons who have not moved are referred to as non-movers and persons who have moved from one residence to another are referred to as movers. Movers include non-migrants and migrants. Non-migrants are persons who did move but remained in the same city, town, township, village or Indian reserve. Migrants include internal migrants who moved to a different city, town, township, village or Indian reserve within Canada. External migrants include persons who lived outside Canada at the earlier reference date.
Return to National Household Survey data footnote 68 referrer
- Footnote 69
-
Refers to the status of a person with regard to the place of residence on the reference day, May 10, 2011, in relation to the place of residence on the same date five years earlier. Persons who have not moved are referred to as non-movers and persons who have moved from one residence to another are referred to as movers. Movers include non-migrants and migrants. Non-migrants are persons who did move but remained in the same city, town, township, village or Indian reserve. Migrants include internal migrants who moved to a different city, town, township, village or Indian reserve within Canada. External migrants include persons who lived outside Canada at the earlier reference date.
Return to National Household Survey data footnote 69 referrer
- Footnote 70
-
'Highest certificate, diploma or degree' refers to the highest certificate, diploma or degree completed based on a hierarchy which is generally related to the amount of time spent 'in-class.' For postsecondary completers, a university education is considered to be a higher level of schooling than a college education, while a college education is considered to be a higher level of education than in the trades. Although some trades requirements may take as long or longer to complete than a given college or university program, the majority of time is spent in on-the-job paid training and less time is spent in the classroom. For further definitions, refer to the National Household Survey Dictionary, Catalogue no. 99-000-X. For any comments on collection, dissemination or data quality for this variable, refer to the Education Reference Guide, National Household Survey, Catalogue no. 99-012-X2011006.
Return to National Household Survey data footnote 70 referrer
- Footnote 71
-
'High school diploma or equivalent' includes persons who have graduated from a secondary school or equivalent. It excludes persons with a postsecondary certificate, diploma or degree.
Return to National Household Survey data footnote 71 referrer
- Footnote 72
-
'Postsecondary certificate, diploma or degree' includes 'apprenticeship or trades certificates or diplomas,' 'college, CEGEP or other non-university certificates or diplomas' and university certificates, diplomas and degrees.
Return to National Household Survey data footnote 72 referrer
- Footnote 73
-
'Apprenticeship or trades certificate or diploma' includes Registered Apprenticeship certificates (including Certificate of Qualification, Journeyperson's designation) and other trades certificates or diplomas such as pre-employment or vocational certificates and diplomas from brief trade programs completed at community colleges, institutes of technology, vocational centres, and similar institutions.
Return to National Household Survey data footnote 73 referrer
- Footnote 74
-
Comparisons with other data sources suggest that the category 'University certificate or diploma below the bachelor's level' was over-reported in the NHS. This category likely includes some responses that are actually college certificates or diplomas, bachelor's degrees or other types of education (e.g., university transfer programs, bachelor's programs completed in other countries, incomplete bachelor's programs, non-university professional designations). We recommend users interpret the results for the 'University certificate or diploma below the bachelor's level' category with caution.
Return to National Household Survey data footnote 74 referrer
- Footnote 75
-
'University certificate, diploma or degree above bachelor level' includes the categories 'University certificate or diploma above bachelor level,' 'Degree in medicine, dentistry, veterinary medicine or optometry,' 'Master's degree' and 'Earned doctorate.'
Return to National Household Survey data footnote 75 referrer
- Footnote 76
-
'Major field of study' is defined as the main discipline or subject of learning. It is collected for the highest certificate, diploma or degree above the high school or secondary school level and classified according to the Classification of Instructional Programs (CIP) Canada 2011. This variable shows the 'primary groupings,' a CIP variant. For more information on the CIP classification, see the Classification of Instructional Programs, Canada 2011, Catalogue no. 12-590-X available from: www.statcan.gc.ca/concepts/classification-eng.htm. For any comments on collection, dissemination or data quality for this variable, refer to the Education Reference Guide, National Household Survey, Catalogue no. 99-012-X2011006.
Return to National Household Survey data footnote 76 referrer
- Footnote 77
-
'No postsecondary certificate, diploma or degree' includes persons who have not completed a registered apprenticeship certificate (including Certificate of Qualification, Journeyperson's designation) or other trades certificate or diploma, a college, CEGEP or other non-university certificate or diploma, or a university certificate, diploma or degree.
Return to National Household Survey data footnote 77 referrer
- Footnote 78
-
Called 'Health, parks, recreation and fitness' in CIP Canada 2000.
Return to National Household Survey data footnote 78 referrer
- Footnote 79
-
Includes 'Multidisciplinary/interdisciplinary studies, other.'
Return to National Household Survey data footnote 79 referrer
- Footnote 80
-
'Location of study compared with province or territory of residence' indicates whether the 'Location of study' is the same as the province or territory of residence in 2011, a different Canadian province or territory, or outside Canada. 'Location of study' refers to the province, territory or country of the institution where the highest certificate, diploma or degree above the high school level was completed. Users should be aware that some respondents may have reported the physical location of study rather than the location of the certificate, diploma or degree-granting institution. This could affect the responses of those who obtained a certificate, diploma or degree through a joint program or by distance learning with credentials granted in another province or country. In particular, a number of persons reported a location of study for a university credential in one of the territories (Yukon, Northwest Territories, Nunavut), even though there were no educational institutions in the territories with the authority to grant university degrees. For any other comments on collection, dissemination or data quality for this variable or 'Location of study,' refer to the Education Reference Guide, National Household Survey, Catalogue no. 99-012-X2011006.
Return to National Household Survey data footnote 80 referrer
- Footnote 81
-
Population by language used most often at work . Refers to the language used most often at work, as reported on May 10, 2011 by the individuals aged 15 years and over who worked since January 1, 2010.
Return to National Household Survey data footnote 81 referrer
- Footnote 82
-
Cree languages include the following categories: Cree not otherwise specified (which refers to those who reported 'Cree'), Swampy Cree, Plains Cree, Woods Cree, and a category labelled 'Cree not included elsewhere' (which includes Moose Cree, Northern East Cree and Southern East Cree).
Return to National Household Survey data footnote 82 referrer
- Footnote 83
-
Refers to whether a person was employed, unemployed or not in the labour force during the week of Sunday, May 1 to Saturday, May 7, 2011. In the past, this variable was called Labour force activity.
Return to National Household Survey data footnote 83 referrer
- Footnote 84
-
Refers to whether an employed person is an employee or is self-employed. The self-employed include persons with or without a business, as well as unpaid family workers.
Return to National Household Survey data footnote 84 referrer
- Footnote 85
-
Includes unemployed persons aged 15 years and over who have never worked for pay or in self-employment or who had last worked prior to January 1, 2010 only.
Return to National Household Survey data footnote 85 referrer
- Footnote 86
-
Experienced labour force refers to persons who, during the week of Sunday, May 1 to Saturday, May 7, 2011, were employed and the unemployed who had last worked for pay or in self-employment in either 2010 or 2011.
Return to National Household Survey data footnote 86 referrer
- Footnote 87
-
Includes self-employed with an incorporated business and self-employed with an unincorporated business. Also included among the self-employed are unpaid family workers.
Return to National Household Survey data footnote 87 referrer
- Footnote 88
-
Refers to the kind of work performed by persons during the week of Sunday, May 1 to Saturday, May 7, 2011, as determined by their kind of work and the description of the main activities in their job. The 2011 National Household Survey occupation data are produced according to the NOC 2011.
Return to National Household Survey data footnote 88 referrer
- Footnote 89
-
Unemployed persons aged 15 years and over who have never worked for pay or in self-employment or who had last worked prior to January 1, 2010 only.
Return to National Household Survey data footnote 89 referrer
- Footnote 90
-
Refers to the general nature of the business carried out in the establishment where the person worked. The 2011 National Household Survey industry data are produced according to the NAICS 2007.
Return to National Household Survey data footnote 90 referrer
- Footnote 91
-
Refers to the number of weeks in which a person worked for pay or in self-employment in 2010 at all jobs held, even if only for a few hours, and whether these weeks were mostly full time (30 hours or more per week) or mostly part time (less than 30 hours per week).
Return to National Household Survey data footnote 91 referrer
- Footnote 92
-
Includes persons who never worked, persons who worked prior to 2010 only, or persons who worked in 2011 only.
Return to National Household Survey data footnote 92 referrer
- Footnote 93
-
Refers to persons who worked for pay or in self-employment in 2010. These persons were asked to report whether the weeks they worked in 2010 were full-time weeks (30 hours or more per week) or not, on the basis of all jobs held. Persons with a part-time job for part of the year and a full-time job for another part of the year were to report the information for the job at which they worked the most weeks.
Return to National Household Survey data footnote 93 referrer
- Footnote 94
-
Classification of respondents according to whether they worked at home, worked outside Canada, had no fixed workplace address or worked at a specific address (usual place of work).
Return to National Household Survey data footnote 94 referrer
- Footnote 95
-
Refers to the main mode of transportation a respondent uses to travel between his or her home and his or her place of work.
Return to National Household Survey data footnote 95 referrer
- Footnote 96
-
Refers to how many minutes it took for a person to travel from home to work. Median commuting duration is the value which divides the commuting duration into two equal halves, i.e., the commuting duration of individuals for the first half is below the median, while the commuting distance of individuals for the second half is above the median.
Return to National Household Survey data footnote 96 referrer
- Footnote 97
-
Time at which a respondent usually leaves home to go to work.
Return to National Household Survey data footnote 97 referrer
- Footnote 98
-
Condition of dwelling - Refers to whether the dwelling is in need of repairs. This does not include desirable remodelling or additions.
Return to National Household Survey data footnote 98 referrer
- Footnote 99
-
Period of construction - Refers to the period in time during which the building or dwelling was originally constructed.
Return to National Household Survey data footnote 99 referrer
- Footnote 100
-
Includes data up to May 10, 2011.
Return to National Household Survey data footnote 100 referrer
- Footnote 101
-
Rooms - Refers to enclosed areas within a private dwelling which are finished and suitable for year round living. The number of rooms of a private dwelling includes kitchens, bedrooms and finished rooms in the attic or basement. The number of rooms of a private dwelling excludes bathrooms, halls, vestibules and rooms used solely for business purposes. Partially divided rooms are considered to be separate rooms if they are considered as such by the respondent (e.g., L-shaped dining room and living room arrangements).
Return to National Household Survey data footnote 101 referrer
- Footnote 102
-
Bedrooms - Refers to rooms in a private dwelling that are designed mainly for sleeping purposes even if they are now used for other purposes, such as guest rooms and television rooms. Also included are rooms used as bedrooms now, even if they were not originally built as bedrooms, such as bedrooms in a finished basement. Bedrooms exclude rooms designed for another use during the day such as dining rooms and living rooms even if they may be used for sleeping purposes at night. By definition, one-room private dwellings such as studio apartments have zero bedrooms.
Return to National Household Survey data footnote 102 referrer
- Footnote 103
-
Tenure - Refers to whether the household owns or rents their private dwelling, or whether the dwelling is band housing (on an Indian reserve or settlement).
Return to National Household Survey data footnote 103 referrer
- Footnote 104
-
Condominium status - Refers to whether the private dwelling is part of a condominium development. A condominium is a residential complex in which dwellings are owned individually while land and common elements are held in joint ownership with others.
Return to National Household Survey data footnote 104 referrer
- Footnote 105
-
Household maintainer - Refers to whether or not a person residing in the household is responsible for paying the rent, or the mortgage, or the taxes, or the electricity or other services or utilities. Where a number of people may contribute to the payments, more than one person in the household may be identified as a household maintainer. If no person in the household is identified as making such payments, the reference person is identified by default.
Return to National Household Survey data footnote 105 referrer
- Footnote 106
-
Primary household maintainer - First person in the household identified as someone who pays the rent or the mortgage, or the taxes, or the electricity bill, and so on, for the dwelling. The order of the persons in a household is determined by the order in which the respondent lists the persons on the questionnaire. Generally, an adult is listed first followed, if applicable, by that person's spouse or common-law partner and by their children. The order does not necessarily correspond to the proportion of household payments made by the person. Age - Refers to the age at last birthday before the reference date, that is, before May 10, 2011.
Return to National Household Survey data footnote 106 referrer
- Footnote 107
-
Persons per room - Refers to an indicator of the level of crowding in a private dwelling. It is calculated by dividing the number of persons in the household by the number of rooms in the dwelling.
Return to National Household Survey data footnote 107 referrer
- Footnote 108
-
Housing suitability - Housing suitability refers to whether a private household is living in suitable accommodations according to the National Occupancy Standard (NOS); that is, whether the dwelling has enough bedrooms for the size and composition of the household. A household is deemed to be living in suitable accommodations if its dwelling has enough bedrooms, as calculated using the National Occupancy Standard. Housing suitability assesses the required number of bedrooms for a household based on the age, sex, and relationships among household members. An alternative variable, the number of persons per room, considers all rooms in a private dwelling and the number of household members. Housing suitability and the National Occupancy Standard (NOS) on which it is based were developed by Canada Mortgage and Housing Corporation (CMHC) through consultations with provincial housing agencies.
Return to National Household Survey data footnote 108 referrer
- Footnote 109
-
Shelter-cost-to-income ratio - Percentage of a household's average total monthly income which is spent on shelter-related expenses. Those expenses include the monthly rent (for tenants) or the mortgage payment, property taxes and condominium fees (for owners) and the costs of electricity, heat, municipal services, etc. The percentage is calculated by dividing the total shelter-related expenses by the household's total monthly income and multiplying the result by 100. Includes owner and tenant households in non-farm, non-reserve private dwellings with household total income greater than zero in 2010 (i.e., excludes negative or zero household total income). The relatively high shelter costs to household income ratios for some households may have resulted from the difference in the reference period for shelter costs and household total income data. The reference period for shelter cost data is 2011, while household total income is reported for the year 2010. As well, for some households, the 2010 household total income may represent income for only part of a year. Household total income - The total income of a household is the sum of the total incomes of all members of that household. Total income refers to the total of income from all sources, including employment income, income from government programs, pension income, investment income and any other money income, before income taxes and deductions, during the calendar year 2010.
Return to National Household Survey data footnote 109 referrer
- Footnote 110
-
Presence of mortgage - Refers to whether the owner households reported mortgage or loan payments for their dwelling.
Return to National Household Survey data footnote 110 referrer
- Footnote 111
-
Shelter-cost-to-income ratio for owner households - Percentage of an owner household's average total monthly income which is spent on shelter-related expenses. Those expenses include the mortgage payment, property taxes and condominium fees and the costs of electricity, heat, municipal services, etc. The percentage is calculated by dividing the total shelter-related expenses by the household's total monthly income and multiplying the result by 100. Includes owner households in non-farm, non-reserve private dwellings with household total income greater than zero in 2010 (i.e., excludes negative or zero household total income). The relatively high shelter costs to household income ratios for some households may have resulted from the difference in the reference period for shelter costs and household total income data. The reference period for shelter cost data is 2011, while household total income is reported for the year 2010. As well, for some households, the 2010 household total income may represent income for only part of a year. Household total income - The total income of a household is the sum of the total incomes of all members of that household. Total income refers to the total of income from all sources, including employment income, income from government programs, pension income, investment income and any other money income, before income taxes and deductions, during the calendar year 2010.
Return to National Household Survey data footnote 111 referrer
- Footnote 112
-
Shelter cost for owned dwellings - Includes all shelter expenses paid by households that own their dwellings, such as the mortgage payment and the costs of electricity, heat, water and other municipal services, property taxes and condominium fees.
Return to National Household Survey data footnote 112 referrer
- Footnote 113
-
Value of dwelling - Refers to the dollar amount expected by the owner if the dwelling were to be sold.
Return to National Household Survey data footnote 113 referrer
- Footnote 114
-
Subsidized housing - Refers to whether the dwelling is subsidized. Subsidized housing includes rent geared to income, social housing, public housing, government-assisted housing, non-profit housing, rent supplements and housing allowances.
Return to National Household Survey data footnote 114 referrer
- Footnote 115
-
Shelter-cost-to-income ratio for tenant households - Percentage of a tenant household's average total monthly income which is spent on shelter-related expenses. Those expenses include the monthly rent and the costs of electricity, heat, municipal services, etc. The percentage is calculated by dividing the total shelter-related expenses by the household's total monthly income and multiplying the result by 100. Includes tenant households in non-farm, non-reserve private dwellings with household total income greater than zero in 2010 (i.e., excludes negative or zero household total income). The relatively high shelter costs to household income ratios for some households may have resulted from the difference in the reference period for shelter costs and household total income data. The reference period for shelter cost data is 2011, while household total income is reported for the year 2010. As well, for some households, the 2010 household total income may represent income for only part of a year. Household total income - The total income of a household is the sum of the total incomes of all members of that household. Total income refers to the total of income from all sources, including employment income, income from government programs, pension income, investment income and any other money income, before income taxes and deductions, during the calendar year 2010.
Return to National Household Survey data footnote 115 referrer
- Footnote 116
-
Shelter costs for rented dwellings - Includes all shelter expenses paid by households that rent their dwellings, such as the monthly rent and the costs of electricity, heat and municipal services.
Return to National Household Survey data footnote 116 referrer
- Footnote 117
-
Total income - Total income refers to monetary receipts from certain sources, before income taxes and deductions, during calendar year 2010. It includes employment income from wages, salaries, tips, commissions and net income from self-employment (for both unincorporated farm and non-farm activities); income from government sources, such as social assistance, child benefits, employment insurance, old age security pension, Canada or Quebec pension plan benefits and disability income; income from employer and personal pension sources, such as private pensions and payments from annuities and RRIFs; income from investment sources, such as dividends and interest on bonds, accounts, GICs and mutual funds; and other regular cash income, such as child support payments received, spousal support payments (alimony) received and scholarships. The monetary receipts included are those that tend to be of a regular and recurring nature. It excludes one-time receipts, such as lottery winnings, gambling winnings, cash inheritances, lump sum insurance settlements, capital gains and RRSP withdrawals. Capital gains are excluded because they are not by their nature regular and recurring. It is further assumed that they are less likely to be fully spent in the period in which they are received, unlike income that is regular and recurring. Also excluded are employer's contributions to registered pension plans, Canada and Quebec pension plans, and employment insurance. Finally, voluntary inter-household transfers, imputed rent, goods and services produced for barter, and goods produced for own consumption are excluded from this total income definition. Median income of individuals - The median income of a specified group of income recipients is that amount which divides their income size distribution into two halves, i.e., the incomes of the first half of individuals are below the median, while those of the second half are above the median. Median income is calculated from the individuals with income in that group (e.g., males aged 45 to 54 years). Average income of individuals - Average income of individuals refers to the weighted mean total income of individuals aged 15 years and over who reported income for 2010. Average income is calculated from unrounded data by dividing the aggregate income of a specified group of individuals (e.g., males aged 45 to 54 years) by the number of individuals with income in that group. Median and average of individuals will be calculated for those individuals who are at least aged 15 years and who have an income (positive or negative). Age - Refers to the age at last birthday before the reference date, that is, before May 10, 2011.
Return to National Household Survey data footnote 117 referrer
- Footnote 118
-
Including loss.
Return to National Household Survey data footnote 118 referrer
- Footnote 119
-
For population with income.
Return to National Household Survey data footnote 119 referrer
- Footnote 120
-
After-tax income - Refers to total income from all sources minus federal, provincial and territorial income taxes paid for 2010. Median income of individuals - The median income of a specified group of income recipients is that amount which divides their income size distribution into two halves, i.e., the incomes of the first half of individuals are below the median, while those of the second half are above the median. Median income is calculated from the individuals with income in that group (e.g., males aged 45 to 54 years). Average income of individuals - Average income of individuals refers to the weighted mean total income of individuals aged 15 years and over who reported income for 2010. Average income is calculated from unrounded data by dividing the aggregate income of a specified group of individuals (e.g., males aged 45 to 54 years) by the number of individuals with income in that group. Median and average of individuals will be calculated for those individuals who are at least aged 15 years and who have an income (positive or negative). Age - Refers to the age at last birthday before the reference date, that is, before May 10, 2011.
Return to National Household Survey data footnote 120 referrer
- Footnote 121
-
Including loss.
Return to National Household Survey data footnote 121 referrer
- Footnote 122
-
For population with after-tax income.
Return to National Household Survey data footnote 122 referrer
- Footnote 123
-
Composition of income - The composition of the total income of a population group or a geographic area refers to the relative share of each income source or group of sources, expressed as a percentage of the aggregate total income of that group or area. Total income - Total of income from all sources, including employment income, income from government programs, pension income, investment income and any other money income. Age - Refers to the age at last birthday before the reference date, that is, before May 10, 2011.
Return to National Household Survey data footnote 123 referrer
- Footnote 124
-
Market income - Refers to the sum of employment income (wages and salaries, net farm income and net income from non-farm unincorporated business and/or professional practice), investment income, retirement pensions, superannuation and annuities (including those from RRSPs and RRIFs) and other money income. It is equivalent to total income before tax minus all government transfers and is also referred to as income before transfers and taxes.
Return to National Household Survey data footnote 124 referrer
- Footnote 125
-
Earnings or employment income - Total wages and salaries and net income from self-employment.
Return to National Household Survey data footnote 125 referrer
- Footnote 126
-
Wages and salaries - Refers to gross wages and salaries before deductions for such items as income tax, pensions and Employment Insurance. Included in this source are military pay and allowances, tips, commissions and cash bonuses, benefits from wage-loss replacement plans or income-maintenance insurance plans, supplementary unemployment benefits from an employer or union as well as all types of casual earnings during calendar year 2010. Other employment income such as taxable benefits, research grants and royalties are included.
Return to National Household Survey data footnote 126 referrer
- Footnote 127
-
Self-employment net income - Refers to the total amount received by persons aged 15 years and over during calendar year 2010 as net farm income from self-employment, or net non-farm income from unincorporated business and/or professional practice. Net farm income - Refers to net income (gross receipts from farm sales minus depreciation and cost of operation) received during calendar year 2010 from the operation of a farm, either on the respondent's own account or in partnership. In the case of partnerships, only the respondent's share of income was reported. Included with gross receipts are cash advances received in 2010, dividends from cooperatives, rebates and farm-support payments to farmers from federal, provincial and regional agricultural programs (for example, milk subsidies and marketing board payments) and gross insurance proceeds such as payments from the AgriInvest and AgriStability programs. The value of income 'in kind,' such as agricultural products produced and consumed on the farm, is excluded. Net non-farm income from unincorporated business and/or professional practice - Refers to net income (gross receipts minus expenses of operation such as wages, rents and depreciation) received during calendar year 2010 from the respondent's non-farm unincorporated business or professional practice. In the case of partnerships, only the respondent's share was reported. Also included is net income from persons babysitting in their own homes, persons providing room and board to non-relatives, self-employed fishers, hunters and trappers, operators of direct distributorships such as those selling and delivering cosmetics, as well as freelance activities of artists, writers, music teachers, hairdressers, dressmakers, etc.
Return to National Household Survey data footnote 127 referrer
- Footnote 128
-
Investment income - Refers to interest received during calendar year 2010 from deposits in banks, trust companies, cooperatives, credit unions, caisses populaires, etc., as well as interest on savings certificates, bonds and debentures, and all dividends from both Canadian and foreign corporate stocks and mutual funds. Also included is other investment income from either Canadian or foreign sources, such as net rents from real estate, mortgage and loan interest received, regular income from an estate or trust fund, and interest from insurance policies. Does not include capital gains or losses.
Return to National Household Survey data footnote 128 referrer
- Footnote 129
-
Retirement pensions - Refers to all regular income received by the respondent during calendar year 2010 as the result of having been a member of a pension plan of one or more employers. It includes payments received from all annuities, including payments from a Registered Retirement Income Fund (RRIF), a matured Registered Retirement Savings Plan (RRSP) in the form of a life annuity, a fixed-term annuity, or an income-averaging annuity contract; pensions paid to widow(er)s or other relatives of deceased pensioners; pensions of retired civil servants, Armed Forces personnel and Royal Canadian Mounted Police (RCMP) officers; annuity payments received from the Canadian Government Annuities Fund, an insurance company, etc. Does not include lump-sum death benefits, lump-sum benefits or withdrawals from a pension plan or RRSP, or refunds of over-contributions.
Return to National Household Survey data footnote 129 referrer
- Footnote 130
-
Other money income - Refers to regular cash income received during calendar year 2010 and not reported in any of the other sources listed on the questionnaire. For example, severance pay and retirement allowances, alimony, child support, periodic support from other persons not in the household, income from abroad (excluding dividends and interest), non refundable scholarships, bursaries, fellowships and study grants, and artists' project grants are included.
Return to National Household Survey data footnote 130 referrer
- Footnote 131
-
Government transfer payments - Refers to all cash benefits received from federal, provincial, territorial or municipal governments during 2010. This variable is derived by summing the amounts reported in: the Old Age Security pension and Guaranteed Income Supplement, Allowance and Allowance for the Survivor; benefits from Canada Pension Plan or Quebec Pension Plan; benefits from Employment Insurance; child benefits; other income from government sources.
Return to National Household Survey data footnote 131 referrer
- Footnote 132
-
Benefits from Canada or Quebec pension plan - Refers to benefits received during calendar year 2010 from the Canada or Quebec Pension Plan (For example, retirement pensions, survivors' benefits and disability pensions). Does not include lump-sum death benefits.
Return to National Household Survey data footnote 132 referrer
- Footnote 133
-
Old Age Security pensions and Guaranteed Income Supplement - Refers to Old Age Security pensions and Guaranteed Income Supplements paid to persons aged 65 years and over, and to the Allowance or Allowance for the survivor paid to 60- to 64-year-old spouses of old age security recipients or widow(er)s by the federal government during the calendar year 2010.
Return to National Household Survey data footnote 133 referrer
- Footnote 134
-
Benefits from employment insurance - Refers to total Employment Insurance benefits received during calendar year 2010, before income tax deductions. It includes benefits for unemployment, sickness, maternity, paternity, adoption, work sharing, retraining and benefits to self-employed fishers received under the federal Employment Insurance Program or the Quebec Parental Insurance Program.
Return to National Household Survey data footnote 134 referrer
- Footnote 135
-
Child benefits - Refers to payments received under the Canada Child Tax Benefit program during calendar year 2010 by parents with dependent children under 18 years of age. Included with the Canada Child Tax Benefit is the National Child Benefit Supplement (NCBS) for low-income families with children. The NCBS is the federal contribution to the National Child Benefit (NCB), a joint initiative of federal, provincial and territorial governments. Also included in this variable are child benefits, child disability benefits and earned income supplements provided by certain provinces and territories and the Universal Child Care Benefit (UCCB).
Return to National Household Survey data footnote 135 referrer
- Footnote 136
-
Other income from government sources - Refers to all transfer payments, excluding those covered as a separate income source (Canada Pension Plan or Quebec Pension Plan benefits, Old Age Security pensions and Guaranteed Income Supplements, Employment Insurance benefits and child benefits) received from federal, provincial, territorial or municipal programs during 2010.
Return to National Household Survey data footnote 136 referrer
- Footnote 137
-
Income tax paid - Refers to all federal, provincial and territorial taxes paid on 2010 income. Federal, provincial and territorial taxes paid refer to taxes on income, after taking into account exemptions, deductions, non-refundable tax credits and the Quebec abatement. These taxes are obtained from the income tax files for persons who allowed access to their income tax data and from direct responses on the questionnaire for others.
Return to National Household Survey data footnote 137 referrer
- Footnote 138
-
After-tax income - Refers to total income from all sources minus federal, provincial and territorial taxes paid for 2010.
Return to National Household Survey data footnote 138 referrer
- Footnote 139
-
Net capital gains or losses - Refers to the net gains received or losses incurred during calendar year 2010 from the sale of capital property. This represents the proceeds of disposition minus the adjusted cost base of the property and outlays and expenses incurred to sell the property. Capital property includes depreciable property and any property which, if sold, would result in a capital gain or loss (for example, cottages, buildings and securities such as mutual funds). Non-taxable capital gains or losses on the sale of a principal residence are excluded. Net capital gains or losses are not included in the definition of Total income as published in standard products. Net capital gains or losses are not included in the concept of total income but are expressed here as a percentage to obtain a relative measure of size.
Return to National Household Survey data footnote 139 referrer
- Footnote 140
-
Earnings or employment income - Refers to total income received by persons 15 years of age and over during calendar year 2010 as wages and salaries, net income from a non-farm unincorporated business and/or professional practice, and/or net farm self-employment income. Wages and salaries - Refers to gross wages and salaries before deductions for such items as income tax, pensions and Employment Insurance. Included in this source are military pay and allowances, tips, commissions and cash bonuses, benefits from wage-loss replacement plans or income-maintenance insurance plans, supplementary unemployment benefits from an employer or union as well as all types of casual earnings during calendar year 2010. Other employment income such as taxable benefits, research grants and royalties are included. Net non-farm income from unincorporated business or professional practice - Refers to net income (gross receipts minus expenses of operation such as wages, rents and depreciation) received during calendar year 2010 from the respondent's non-farm unincorporated business or professional practice. In the case of partnerships, only the respondent's share was reported. Also included is net income from persons babysitting in their own homes, persons providing room and board to non-relatives, self-employed fishers, hunters and trappers, operators of direct distributorships such as those selling and delivering cosmetics, as well as freelance activities of artists, writers, music teachers, hairdressers, dressmakers, etc. Net farm income - Refers to net income (gross receipts from farm sales minus depreciation and cost of operation) received during calendar year 2010 from the operation of a farm, either on the respondent's own account or in partnership. In the case of partnerships, only the respondent's share of income was reported. Included with gross receipts are cash advances received in 2010, dividends from cooperatives, rebates and farm-support payments to farmers from federal, provincial and regional agricultural programs (for example, milk subsidies and marketing board payments) and gross insurance proceeds such as payments from the AgriInvest and AgriStability programs. The value of income 'in kind,' such as agricultural products produced and consumed on the farm, is excluded. Median income of individuals - The median income of a specified group of income recipients is that amount which divides their income size distribution, ranked by size of income, into two halves, i.e., the incomes of the first half of individuals are below the median, while those of the second half are above the median. Median income is calculated from the unrounded number of individuals (e.g., males aged 45 to 54 years) with income in that group. Average income of individuals - Average income of individuals refers to the weighted mean total income of individuals aged 15 years and over who reported income for 2010. Average income is calculated from unrounded data by dividing the aggregate income of a specified group of individuals (e.g., males aged 45 to 54 years) by the number of individuals with income in that group. Median and average incomes of individuals will be calculated for those individuals who are at least aged 15 years and who have an income (positive or negative). The above concept and procedures also apply in the calculation of these statistics for earnings. Work activity in 2010 - Refers to the number of weeks in which a person worked for pay or in self-employment in 2010 at all jobs held, even if only for a few hours, and whether these weeks were mostly full time (30 hours or more per week) or mostly part time (less than 30 hours per week). Age - Refers to the age at last birthday before the reference date, that is, before May 10, 2011.
Return to National Household Survey data footnote 140 referrer
- Footnote 141
-
Economic family total income - The total income of an economic family is the sum of the total incomes of all members of that family. Total income - Total income refers to monetary receipts from certain sources, before income taxes and deductions, during calendar year 2010. It includes employment income from wages, salaries, tips, commissions and net income from self-employment (for both unincorporated farm and non-farm activities); income from government sources, such as social assistance, child benefits, employment insurance, old age security pension, Canada or Quebec pension plan benefits and disability income; income from employer and personal pension sources, such as private pensions and payments from annuities and RRIFs; income from investment sources, such as dividends and interest on bonds, accounts, GICs and mutual funds; and other regular cash income, such as child support payments received, spousal support payments (alimony) received and scholarships. The monetary receipts included are those that tend to be of a regular and recurring nature. It excludes one-time receipts, such as lottery winnings, gambling winnings, cash inheritances, lump sum insurance settlements, capital gains and RRSP withdrawals. Capital gains are excluded because they are not by their nature regular and recurring. It is further assumed that they are less likely to be fully spent in the period in which they are received, unlike income that is regular and recurring. Also excluded are employer's contributions to registered pension plans, Canada and Quebec pension plans, and employment insurance. Finally, voluntary inter-household transfers, imputed rent, goods and services produced for barter, and goods produced for own consumption are excluded from this total income definition. After-tax income of economic families - The after-tax income of an economic family is the sum of the after-tax incomes of all members of that family. After-tax income of family members or persons not in families refers to total income from all sources minus federal, provincial and territorial income taxes paid for 2010. Median income of economic families - The median income of a specified group of families is that amount which divides their income size distribution, ranked by size of income, into two halves. That is, the incomes of the first half of the families are below the median, while those of the second half are above the median. Median incomes of families are normally calculated for all units in the specified group, whether or not they reported income. Average income of economic families - Average income of economic families refers to the weighted mean total income of families in 2010. Average income is calculated from unrounded data by dividing the aggregate income of a specified group of families (for example, husband-wife families with working wives) by the number of families in that group, whether or not they reported income. The above concept and procedures also apply in the calculation of these statistics on the after-tax income of economic families. Economic family - Refers to a group of two or more persons who live in the same dwelling and are related to each other by blood, marriage, common-law, adoption or a foster relationship. A couple may be of opposite or same sex.
Return to National Household Survey data footnote 141 referrer
- Footnote 142
-
Economic family structure - Refers to the classification of economic families as couple families, lone-parent families or other economic families. Couple families - Those in which a member of either a married or common-law couple is the economic family reference person. Lone-parent families - Those in which either a male or female lone parent is the economic family reference person. Other economic families - Those in which the economic family reference person has other relatives but does not have a married spouse or common-law partner or a child in their census family.
Return to National Household Survey data footnote 142 referrer
- Footnote 143
-
Economic family structure - Refers to the classification of economic families as couple families, lone-parent families or other economic families. Couple families - Those in which a member of either a married or common-law couple is the economic family reference person. Lone-parent families - Those in which either a male or female lone parent is the economic family reference person. Other economic families - Those in which the economic family reference person has other relatives but does not have a married spouse or common-law partner or a child in their census family. Presence of children - Refers to the number of children in private households by age groups. To be included, children must live in the same household as the family, without a married spouse, common-law partner or one or more of their children living in the same household. In a census family, they may be children by birth, marriage or adoption. In an economic family, foster children are also included.
Return to National Household Survey data footnote 143 referrer
- Footnote 144
-
Economic family structure - Refers to the classification of economic families as couple families, lone-parent families or other economic families. Couple families - Those in which a member of either a married or common-law couple is the economic family reference person. Lone-parent families - Those in which either a male or female lone parent is the economic family reference person. Other economic families - Those in which the economic family reference person has other relatives but does not have a married spouse or common-law partner or a child in their census family.
Return to National Household Survey data footnote 144 referrer
- Footnote 145
-
Total income - Total income refers to monetary receipts from certain sources, before income taxes and deductions, during calendar year 2010. It includes employment income from wages, salaries, tips, commissions and net income from self-employment (for both unincorporated farm and non-farm activities); income from government sources, such as social assistance, child benefits, employment insurance, old age security pension, Canada or Quebec pension plan benefits and disability income; income from employer and personal pension sources, such as private pensions and payments from annuities and RRIFs; income from investment sources, such as dividends and interest on bonds, accounts, GICs and mutual funds; and other regular cash income, such as child support payments received, spousal support payments (alimony) received and scholarships. The monetary receipts included are those that tend to be of a regular and recurring nature. It excludes one-time receipts, such as lottery winnings, gambling winnings, cash inheritances, lump sum insurance settlements, capital gains and RRSP withdrawals. Capital gains are excluded because they are not by their nature regular and recurring. It is further assumed that they are less likely to be fully spent in the period in which they are received, unlike income that is regular and recurring. Also excluded are employer's contributions to registered pension plans, Canada and Quebec pension plans, and employment insurance. Finally, voluntary inter-household transfers, imputed rent, goods and services produced for barter, and goods produced for own consumption are excluded from this total income definition. After-tax income - Refers to total income from all sources minus federal, provincial and territorial income taxes paid for 2010. Median income of persons not in economic families - The median income of a specified group of persons not in economic families (for example, males aged 55 to 64) is that amount which divides their income size distribution, ranked by size of income, into two halves. That is, the incomes of the first half of the persons are below the median, while those of the second half are above the median. Median incomes of persons not in economic families are normally calculated for all units in the specified group, whether or not they reported income. Average income of persons not in economic families - Average income of persons not in economic families refers to the weighted mean total income of the persons not in economic families in 2010. Average income is calculated from unrounded data by dividing the aggregate income of a specified group of persons not in economic families by the number of persons in that group, whether or not they reported income. The above concept and procedures also apply in the calculation of these statistics on the after-tax income of persons not in economic families. Age - Refers to the age at last birthday before the reference date, that is, before May 10, 2011. Economic family persons refer to two or more household members who are related to each other by blood, marriage, common-law, adoption or a foster relationship, and thereby constitute an economic family. Persons not in economic families refer to household members who do not belong to an economic family, including persons living alone.
Return to National Household Survey data footnote 145 referrer
- Footnote 146
-
Calculation includes persons not in economic families without income (with an income of zero).
Return to National Household Survey data footnote 146 referrer
- Footnote 147
-
Calculation includes persons not in economic families without after-tax income (with an after-tax income of zero).
Return to National Household Survey data footnote 147 referrer
- Footnote 148
-
Adjusted after-tax income for economic families and persons not in economic families - For economic family members, this refers to economic family after-tax income that has been adjusted by a factor that accounts for family size. The adjustment factor takes into account the lower relative needs of additional family members, as compared to a single person living alone. For use with the NHS income data, the adjusted after-tax income is computed as the economic family after-tax income divided by the square root of family size. For persons not in economic families, the adjusted after-tax income is set at after-tax income. This is equivalent to a factor of 1.0 for a person not in an economic family. Decile of adjusted after-tax family income - The deciles divide the population ranked by size of adjusted after-tax family income into 10 groups of equal size. The population in the bottom decile is the one who falls in the lower 10 percent of the adjusted after-tax family income distribution. The population in the top decile is the one who falls in the highest ten percent of the adjusted after-tax family income distribution. The 10 groups were formed with the full population in private households of Canada, whether or not they reported income.
Return to National Household Survey data footnote 148 referrer
- Footnote 149
-
Household total income - The total income of a household is the sum of the total incomes of all members of that household. Total income - Total income refers to monetary receipts from certain sources, before income taxes and deductions, during calendar year 2010. It includes employment income from wages, salaries, tips, commissions and net income from self-employment (for both unincorporated farm and non-farm activities); income from government sources, such as social assistance, child benefits, employment insurance, old age security pension, Canada or Quebec pension plan benefits and disability income; income from employer and personal pension sources, such as private pensions and payments from annuities and RRIFs; income from investment sources, such as dividends and interest on bonds, accounts, GICs and mutual funds; and other regular cash income, such as child support payments received, spousal support payments (alimony) received and scholarships. The monetary receipts included are those that tend to be of a regular and recurring nature. It excludes one-time receipts, such as lottery winnings, gambling winnings, cash inheritances, lump sum insurance settlements, capital gains and RRSP withdrawals. Capital gains are excluded because they are not by their nature regular and recurring. It is further assumed that they are less likely to be fully spent in the period in which they are received, unlike income that is regular and recurring. Also excluded are employer's contributions to registered pension plans, Canada and Quebec pension plans, and employment insurance. Finally, voluntary inter-household transfers, imputed rent, goods and services produced for barter, and goods produced for own consumption are excluded from this total income definition. Household, private - Refers to a person or a group of persons (other than foreign residents) who occupy the same private dwelling and do not have a usual place of residence elsewhere in Canada. Household members who are temporarily absent on May 10, 2011 (e.g., temporarily residing elsewhere) are considered as part of their usual household. Every person is a member of one and only one household.
Return to National Household Survey data footnote 149 referrer
- Footnote 150
-
After-tax income of households - The after-tax income of a household is the sum of the after-tax incomes of all members of that household. After-tax income - Refers to total income from all sources minus federal, provincial and territorial income taxes paid for 2010. Household, private - Refers to a person or a group of persons (other than foreign residents) who occupy the same private dwelling and do not have a usual place of residence elsewhere in Canada. Household members who are temporarily absent on May 10, 2011 (e.g., temporarily residing elsewhere) are considered as part of their usual household. Every person is a member of one and only one household.
Return to National Household Survey data footnote 150 referrer
- Footnote 151
-
Household total income - The total income of a household is the sum of the total incomes of all members of that household. After-tax income of households - The after-tax income of a household is the sum of the after-tax incomes of all members of that household. Total income - Total of income from all sources, including employment income, income from government programs, pension income, investment income and any other money income. After-tax income - Refers to total income from all sources minus federal, provincial and territorial income taxes paid for 2010. Median income of households - The median income of a specified group of households is that amount which divides their income size distribution, ranked by size of income, into two halves. That is, the incomes of the first half of the households are below the median, while those of the second half are above the median. Median incomes of households are normally calculated for all units in the specified group, whether or not they reported income. Average income of households - Average income of households refers to the weighted mean total income of households in 2010. Average income is calculated from unrounded data by dividing the aggregate income of a specified group of households (for example, two person households) by the number of households in that specific group, whether or not they reported income. The above concept and procedures also apply in the calculation of these statistics on the after-tax income of households. Household, private - Refers to a person or a group of persons (other than foreign residents) who occupy the same private dwelling and do not have a usual place of residence elsewhere in Canada. Household members who are temporarily absent on May 10, 2011 (e.g., temporarily residing elsewhere) are considered as part of their usual household. Every person is a member of one and only one household.
Return to National Household Survey data footnote 151 referrer
- Footnote 152
-
Household size - Refers to the number of usual residents in a private household.
Return to National Household Survey data footnote 152 referrer
- Footnote 153
-
Income status can be measured in several different ways in household surveys. For the standard products of the National Household Survey, the line chosen is a relative measure: the after-tax low-income measure (LIM-AT). For this measure, the income used is after-tax income of households. There are no regional variations to account for prices or cost of living differences: all applicable households in Canada face the same line adjusted for household size. This line is set at half the median of adjusted household after-tax income. To account for potential economies of scale, the income of households with more than one member is divided by the square root of the size of the household. All household members are considered to share the household income and are attributed the same income status. Note: Low-income estimates in the 2011 National Household Survey. For the 2011 National Household Survey (NHS), low-income statistics are presented based on the after-tax low-income measure (LIM-AT). This measure is not related to the low-income cut-offs (LICO) presented in the 2006 Census and prevalence rates are conceptually not comparable. Because of the sensitivity of certain income indicators to differences in methodology and response patterns, direct comparisons to establish trends with low-income estimates from other household surveys, administrative programs or the 2006 Census are discouraged. The prevalence rates observed in the NHS at the national level are generally 1 to 2 percentage points higher than seen for similar concepts in other programs. However, analysis of the NHS data suggests that it is valid to compare low-income data for different sub-populations within the NHS (i.e., for different geographic areas or demographic groups). For more information, refer to the Income Reference Guide, National Household Survey, Catalogue no. 99-014-X2011006. Age - Refers to the age at last birthday before the reference date, that is, before May 10, 2011.
Return to National Household Survey data footnote 153 referrer
How to cite
How to cite: Statistics Canada. 2013. Beauséjour, New Brunswick (Code 13002) (table). National Household Survey (NHS) Profile. 2011 National Household Survey. Statistics Canada Catalogue no. 99-004-XWE. Ottawa. Released September 11, 2013.
http://www12.statcan.gc.ca/nhs-enm/2011/dp-pd/prof/index.cfm?Lang=E (accessed May 16, 2024).
Data source
2011 National Household Survey
NHS data quality
Beauséjour, New Brunswick
- Global non-response rate (GNR) = 26.2%
Download NHS data for a complete geographic level
Census data
Census data
| Characteristic |
Beauséjour
New Brunswick (Federal electoral district, 2013 Representation Order) |
||
|---|---|---|---|
| Total | Male | Female | |
| Population and dwelling counts | |||
| Population in 2011Census data footnote 1 | .. | ... | ... |
| Population in 2006Census data footnote 1 | .. | ... | ... |
| 2006 to 2011 population change (%) | .. | ... | ... |
| Total private dwellingsCensus data footnote 2 | .. | ... | ... |
| Private dwellings occupied by usual residentsCensus data footnote 3 | .. | ... | ... |
| Population density per square kilometre | .. | ... | ... |
| Land area (square km) | .. | ... | ... |
| Age characteristics | |||
| Total population by age groupsCensus data footnote 4 | 80,415 | 39,845 | 40,570 |
| 0 to 4 years | 3,750 | 1,870 | 1,885 |
| 5 to 9 years | 3,805 | 1,935 | 1,875 |
| 10 to 14 years | 3,910 | 2,005 | 1,910 |
| 15 to 19 years | 4,340 | 2,270 | 2,070 |
| 15 years | 865 | 470 | 400 |
| 16 years | 845 | 430 | 415 |
| 17 years | 900 | 455 | 440 |
| 18 years | 860 | 475 | 385 |
| 19 years | 865 | 445 | 425 |
| 20 to 24 years | 4,045 | 2,080 | 1,970 |
| 25 to 29 years | 4,195 | 2,075 | 2,120 |
| 30 to 34 years | 4,940 | 2,400 | 2,535 |
| 35 to 39 years | 5,415 | 2,640 | 2,770 |
| 40 to 44 years | 5,605 | 2,815 | 2,795 |
| 45 to 49 years | 6,750 | 3,400 | 3,355 |
| 50 to 54 years | 6,910 | 3,420 | 3,485 |
| 55 to 59 years | 6,915 | 3,435 | 3,480 |
| 60 to 64 years | 6,310 | 3,180 | 3,130 |
| 65 to 69 years | 4,470 | 2,310 | 2,160 |
| 70 to 74 years | 3,240 | 1,620 | 1,615 |
| 75 to 79 years | 2,440 | 1,100 | 1,340 |
| 80 to 84 years | 1,605 | 695 | 910 |
| 85 years and over | 1,765 | 600 | 1,165 |
| Median age of the populationCensus data footnote 5 | 45.2 | 44.7 | 45.6 |
| % of the population aged 15 and over | 85.7 | 85.4 | 86.0 |
| Marital status | |||
| Total population 15 years and over by marital statusCensus data footnote 6 | 68,945 | 34,040 | 34,905 |
| Married or living with a common-law partner | 44,395 | 22,165 | 22,230 |
| Married (and not separated) | 35,770 | 17,900 | 17,865 |
| Living common law | 8,625 | 4,265 | 4,360 |
| Not married and not living with a common-law partner | 24,550 | 11,875 | 12,680 |
| Single (never legally married) | 15,360 | 8,690 | 6,670 |
| Separated | 2,195 | 1,005 | 1,185 |
| Divorced | 2,905 | 1,345 | 1,560 |
| Widowed | 4,095 | 830 | 3,260 |
| Family characteristics | |||
| Total number of census families in private householdsCensus data footnote 7 | 24,960 | ... | ... |
| Size of census family: 2 persons | 14,395 | ... | ... |
| Size of census family: 3 persons | 5,375 | ... | ... |
| Size of census family: 4 persons | 4,110 | ... | ... |
| Size of census family: 5 or more persons | 1,085 | ... | ... |
| Total number of census families in private householdsCensus data footnote 8 | 24,965 | ... | ... |
| Total couple families by family structure and number of children | 21,870 | ... | ... |
| Married couples | 17,565 | ... | ... |
| Without children at home | 9,800 | ... | ... |
| With children at home | 7,765 | ... | ... |
| 1 child | 3,570 | ... | ... |
| 2 children | 3,340 | ... | ... |
| 3 or more children | 860 | ... | ... |
| Common-law couples | 4,305 | ... | ... |
| Without children at home | 2,575 | ... | ... |
| With children at home | 1,730 | ... | ... |
| 1 child | 955 | ... | ... |
| 2 children | 590 | ... | ... |
| 3 or more children | 185 | ... | ... |
| Total lone-parent families by sex of parent and number of children | 3,095 | ... | ... |
| Female parent | 2,395 | ... | ... |
| 1 child | 1,520 | ... | ... |
| 2 children | 675 | ... | ... |
| 3 or more children | 195 | ... | ... |
| Male parent | 700 | ... | ... |
| 1 child | 500 | ... | ... |
| 2 children | 175 | ... | ... |
| 3 or more children | 30 | ... | ... |
| Total children in census families in private households | 20,260 | ... | ... |
| Under six years of age | 4,480 | ... | ... |
| 6 to 14 years | 6,920 | ... | ... |
| 15 to 17 years | 2,550 | ... | ... |
| 18 to 24 years | 3,895 | ... | ... |
| 25 years and over | 2,410 | ... | ... |
| Average number of children at home per census family | 0.8 | ... | ... |
| Household and dwelling characteristics | |||
| Total number of persons in private households | 78,095 | 38,555 | 39,535 |
| Number of persons not in census families | 11,000 | 5,205 | 5,800 |
| Living with relativesCensus data footnote 9 | 1,440 | 620 | 820 |
| Living with non-relatives only | 2,400 | 1,250 | 1,155 |
| Living alone | 7,165 | 3,340 | 3,830 |
| Number of census family persons | 67,095 | 33,350 | 33,740 |
| Average number of persons per census family | 2.7 | ... | ... |
| Total number of persons aged 65 years and over in private households | 12,305 | 5,925 | 6,380 |
| Number of persons not in census families aged 65 years and over | 3,505 | 1,160 | 2,350 |
| Living with relativesCensus data footnote 9 | 585 | 165 | 430 |
| Living with non-relatives only | 280 | 135 | 150 |
| Living alone | 2,630 | 860 | 1,770 |
| Number of census family persons aged 65 years and over | 8,800 | 4,770 | 4,035 |
| Total number of private households by household typeCensus data footnote 10 | 32,680 | ... | ... |
| Census-family households | 24,415 | ... | ... |
| One-family-only householdsCensus data footnote 11 | 22,685 | ... | ... |
| Couple-family householdsCensus data footnote 12 | 20,270 | ... | ... |
| Without children | 11,445 | ... | ... |
| With children | 8,820 | ... | ... |
| Lone-parent-family households | 2,420 | ... | ... |
| Other family householdsCensus data footnote 13 | 1,730 | ... | ... |
| One-family households with persons not in a census family | 1,185 | ... | ... |
| Couple-family householdsCensus data footnote 14 | 795 | ... | ... |
| Without children | 390 | ... | ... |
| With children | 405 | ... | ... |
| Lone-parent-family households | 390 | ... | ... |
| Two-or-more-family households | 545 | ... | ... |
| Non-census-family households | 8,260 | ... | ... |
| One-person households | 7,165 | ... | ... |
| Two-or-more-person households | 1,095 | ... | ... |
| Total number of occupied private dwellings by structural type of dwellingCensus data footnote 15 | 32,675 | ... | ... |
| Single-detached house | 26,180 | ... | ... |
| Apartment, building that has five or more storeys | 90 | ... | ... |
| Movable dwellingCensus data footnote 16 | 1,560 | ... | ... |
| Other dwellingCensus data footnote 17 | 4,850 | ... | ... |
| Semi-detached house | 955 | ... | ... |
| Row house | 645 | ... | ... |
| Apartment, duplex | 880 | ... | ... |
| Apartment, building that has fewer than five storeys | 2,260 | ... | ... |
| Other single-attached house | 105 | ... | ... |
| Total number of private households by household sizeCensus data footnote 18 | 32,680 | ... | ... |
| 1 person | 7,165 | ... | ... |
| 2 persons | 13,895 | ... | ... |
| 3 persons | 5,570 | ... | ... |
| 4 persons | 4,430 | ... | ... |
| 5 persons | 1,195 | ... | ... |
| 6 or more persons | 425 | ... | ... |
| Number of persons in private households | 78,090 | ... | ... |
| Average number of persons in private households | 2.4 | ... | ... |
| Detailed mother tongue | |||
| Detailed mother tongue - Total population excluding institutional residentsCensus data footnote 19 | 78,450 | 38,695 | 39,750 |
| Single responses | 77,205 | 38,080 | 39,125 |
| English | 26,390 | 13,130 | 13,260 |
| French | 49,735 | 24,435 | 25,305 |
| Non-official languages | 1,080 | 515 | 565 |
| Selected Aboriginal languagesCensus data footnote 20 | 80 | 45 | 40 |
| Atikamekw | 0 | 0 | 0 |
| Cree, n.o.s. | 0 | 0 | 0 |
| Dene | 0 | 0 | 0 |
| Innu/Montagnais | 0 | 0 | 0 |
| Inuktitut | 0 | 0 | 0 |
| Mi'kmaq | 80 | 45 | 40 |
| Ojibway | 0 | 0 | 0 |
| Oji-Cree | 0 | 0 | 0 |
| Stoney | 0 | 0 | 0 |
| Selected non-Aboriginal languagesCensus data footnote 21 | 985 | 460 | 525 |
| African languages, n.i.e. | 0 | 0 | 0 |
| Afrikaans | 5 | 5 | 0 |
| Akan (Twi) | 0 | 0 | 0 |
| Albanian | 0 | 0 | 0 |
| Amharic | 5 | 0 | 5 |
| Arabic | 40 | 20 | 20 |
| Armenian | 0 | 0 | 0 |
| Bantu languages, n.i.e. | 0 | 0 | 5 |
| Bengali | 0 | 0 | 0 |
| Berber languages (Kabyle) | 0 | 0 | 0 |
| Bisayan languages | 10 | 5 | 5 |
| Bosnian | 0 | 0 | 0 |
| Bulgarian | 0 | 0 | 0 |
| Burmese | 0 | 0 | 0 |
| Cantonese | 10 | 5 | 5 |
| Chinese, n.o.s. | 30 | 20 | 15 |
| Creoles | 5 | 0 | 5 |
| Croatian | 0 | 0 | 0 |
| Czech | 5 | 0 | 5 |
| Danish | 10 | 0 | 5 |
| Dutch | 65 | 30 | 35 |
| Estonian | 0 | 0 | 0 |
| Finnish | 10 | 5 | 5 |
| Flemish | 0 | 0 | 0 |
| Fukien | 0 | 0 | 0 |
| German | 230 | 125 | 100 |
| Greek | 0 | 0 | 5 |
| Gujarati | 0 | 0 | 0 |
| Hakka | 0 | 0 | 0 |
| Hebrew | 0 | 5 | 0 |
| Hindi | 10 | 5 | 0 |
| Hungarian | 15 | 10 | 10 |
| Ilocano | 5 | 5 | 5 |
| Indo-Iranian languages, n.i.e. | 0 | 0 | 0 |
| Italian | 35 | 25 | 15 |
| Japanese | 15 | 5 | 10 |
| Khmer (Cambodian) | 0 | 0 | 5 |
| Korean | 110 | 50 | 55 |
| Kurdish | 0 | 0 | 0 |
| Lao | 0 | 0 | 0 |
| Latvian | 0 | 0 | 0 |
| Lingala | 0 | 0 | 0 |
| Lithuanian | 0 | 0 | 0 |
| Macedonian | 0 | 5 | 0 |
| Malay | 0 | 0 | 0 |
| Malayalam | 5 | 5 | 0 |
| Maltese | 0 | 0 | 0 |
| Mandarin | 0 | 0 | 0 |
| Marathi | 0 | 5 | 0 |
| Nepali | 0 | 0 | 0 |
| Niger-Congo languages, n.i.e. | 5 | 0 | 0 |
| Norwegian | 5 | 0 | 0 |
| Oromo | 5 | 0 | 0 |
| Panjabi (Punjabi) | 10 | 0 | 5 |
| Pashto | 0 | 0 | 0 |
| Persian (Farsi) | 5 | 0 | 0 |
| Polish | 15 | 10 | 10 |
| Portuguese | 20 | 15 | 15 |
| Romanian | 25 | 20 | 5 |
| Rundi (Kirundi) | 0 | 0 | 0 |
| Russian | 10 | 5 | 5 |
| Rwanda (Kinyarwanda) | 0 | 0 | 0 |
| Semitic languages, n.i.e. | 0 | 0 | 0 |
| Serbian | 5 | 0 | 0 |
| Serbo-Croatian | 5 | 0 | 0 |
| Shanghainese | 0 | 0 | 0 |
| Sign languages, n.i.e. | 5 | 0 | 0 |
| Sindhi | 0 | 0 | 0 |
| Sinhala (Sinhalese) | 0 | 0 | 0 |
| Sino-Tibetan languages, n.i.e. | 0 | 0 | 0 |
| Slavic languages, n.i.e. | 0 | 0 | 0 |
| Slovak | 5 | 0 | 0 |
| Slovenian | 0 | 0 | 0 |
| Somali | 0 | 0 | 0 |
| Spanish | 85 | 35 | 50 |
| Swahili | 5 | 5 | 0 |
| Swedish | 5 | 0 | 5 |
| Tagalog (Pilipino, Filipino) | 85 | 25 | 65 |
| Taiwanese | 0 | 0 | 0 |
| Tamil | 5 | 0 | 0 |
| Telugu | 0 | 0 | 0 |
| Thai | 5 | 0 | 5 |
| Tibetan languages | 0 | 0 | 0 |
| Tigrigna | 0 | 0 | 0 |
| Turkish | 0 | 0 | 0 |
| Ukrainian | 5 | 0 | 5 |
| Urdu | 5 | 0 | 0 |
| Vietnamese | 20 | 10 | 5 |
| Yiddish | 0 | 0 | 0 |
| Other languagesCensus data footnote 22 | 15 | 10 | 5 |
| Multiple responses | 1,240 | 615 | 625 |
| English and French | 1,135 | 565 | 570 |
| English and non-official language | 65 | 30 | 35 |
| French and non-official language | 25 | 10 | 15 |
| English, French and non-official language | 10 | 5 | 5 |
| Knowledge of official languages | |||
| Knowledge of official languages - Total population excluding institutional residentsCensus data footnote 19 | 78,450 | 38,695 | 39,755 |
| English only | 20,600 | 10,480 | 10,120 |
| French only | 5,910 | 2,690 | 3,215 |
| English and French | 51,895 | 25,495 | 26,395 |
| Neither English nor French | 50 | 20 | 25 |
| First official language spoken | |||
| First official language spoken - Total population excluding institutional residentsCensus data footnote 19 | 78,445 | 38,695 | 39,755 |
| English | 27,980 | 13,920 | 14,060 |
| French | 50,050 | 24,575 | 25,475 |
| English and French | 380 | 180 | 200 |
| Neither English nor French | 40 | 20 | 20 |
| Official language minority (number)Census data footnote 23 | 50,235 | 24,665 | 25,570 |
| Official language minority (percentage)Census data footnote 23 | 64.0 | 63.7 | 64.3 |
| Detailed language spoken most often at home | |||
| Detailed language spoken most often at home - Total population excluding institutional residentsCensus data footnote 19 | 78,450 | 38,695 | 39,755 |
| Single responses | 77,075 | 38,040 | 39,030 |
| English | 29,700 | 14,870 | 14,825 |
| French | 46,885 | 22,950 | 23,935 |
| Non-official languages | 490 | 220 | 265 |
| Selected Aboriginal languagesCensus data footnote 20 | 10 | 5 | 10 |
| Atikamekw | 0 | 0 | 0 |
| Cree, n.o.s. | 0 | 0 | 0 |
| Dene | 0 | 0 | 0 |
| Innu/Montagnais | 0 | 0 | 0 |
| Inuktitut | 0 | 0 | 0 |
| Mi'kmaq | 15 | 5 | 10 |
| Ojibway | 0 | 0 | 0 |
| Oji-Cree | 0 | 0 | 0 |
| Stoney | 0 | 0 | 0 |
| Selected non-Aboriginal languagesCensus data footnote 21 | 475 | 220 | 255 |
| African languages, n.i.e. | 0 | 0 | 0 |
| Afrikaans | 5 | 0 | 0 |
| Akan (Twi) | 0 | 0 | 0 |
| Albanian | 0 | 0 | 0 |
| Amharic | 0 | 0 | 0 |
| Arabic | 20 | 5 | 10 |
| Armenian | 5 | 5 | 0 |
| Bantu languages, n.i.e. | 0 | 0 | 0 |
| Bengali | 0 | 0 | 0 |
| Berber languages (Kabyle) | 0 | 0 | 0 |
| Bisayan languages | 0 | 0 | 0 |
| Bosnian | 0 | 0 | 0 |
| Bulgarian | 0 | 0 | 0 |
| Burmese | 0 | 0 | 0 |
| Cantonese | 5 | 0 | 5 |
| Chinese, n.o.s. | 25 | 15 | 10 |
| Creoles | 5 | 0 | 5 |
| Croatian | 0 | 0 | 0 |
| Czech | 5 | 0 | 5 |
| Danish | 0 | 0 | 5 |
| Dutch | 20 | 10 | 15 |
| Estonian | 0 | 0 | 0 |
| Finnish | 0 | 0 | 0 |
| Flemish | 0 | 0 | 0 |
| Fukien | 0 | 0 | 0 |
| German | 100 | 50 | 45 |
| Greek | 0 | 0 | 0 |
| Gujarati | 0 | 0 | 0 |
| Hakka | 0 | 0 | 0 |
| Hebrew | 0 | 0 | 0 |
| Hindi | 0 | 0 | 0 |
| Hungarian | 5 | 0 | 0 |
| Ilocano | 0 | 0 | 0 |
| Indo-Iranian languages, n.i.e. | 0 | 0 | 0 |
| Italian | 10 | 5 | 5 |
| Japanese | 0 | 0 | 0 |
| Khmer (Cambodian) | 0 | 0 | 0 |
| Korean | 90 | 50 | 45 |
| Kurdish | 0 | 0 | 0 |
| Lao | 0 | 0 | 0 |
| Latvian | 0 | 0 | 0 |
| Lingala | 0 | 0 | 0 |
| Lithuanian | 0 | 0 | 0 |
| Macedonian | 0 | 0 | 0 |
| Malay | 0 | 0 | 0 |
| Malayalam | 0 | 0 | 0 |
| Maltese | 0 | 0 | 0 |
| Mandarin | 0 | 0 | 0 |
| Marathi | 0 | 0 | 0 |
| Nepali | 0 | 0 | 0 |
| Niger-Congo languages, n.i.e. | 0 | 0 | 0 |
| Norwegian | 0 | 0 | 0 |
| Oromo | 0 | 0 | 0 |
| Panjabi (Punjabi) | 0 | 5 | 0 |
| Pashto | 0 | 0 | 0 |
| Persian (Farsi) | 5 | 0 | 0 |
| Polish | 0 | 0 | 0 |
| Portuguese | 5 | 0 | 0 |
| Romanian | 20 | 15 | 5 |
| Rundi (Kirundi) | 0 | 0 | 0 |
| Russian | 5 | 5 | 5 |
| Rwanda (Kinyarwanda) | 0 | 0 | 0 |
| Semitic languages, n.i.e. | 0 | 0 | 0 |
| Serbian | 0 | 0 | 0 |
| Serbo-Croatian | 0 | 0 | 0 |
| Shanghainese | 0 | 0 | 0 |
| Sign languages, n.i.e. | 10 | 10 | 10 |
| Sindhi | 0 | 0 | 0 |
| Sinhala (Sinhalese) | 0 | 0 | 0 |
| Sino-Tibetan languages, n.i.e. | 0 | 0 | 0 |
| Slavic languages, n.i.e. | 0 | 0 | 0 |
| Slovak | 5 | 0 | 0 |
| Slovenian | 0 | 0 | 0 |
| Somali | 0 | 0 | 0 |
| Spanish | 50 | 20 | 30 |
| Swahili | 0 | 0 | 0 |
| Swedish | 0 | 0 | 0 |
| Tagalog (Pilipino, Filipino) | 65 | 20 | 45 |
| Taiwanese | 0 | 0 | 0 |
| Tamil | 0 | 0 | 0 |
| Telugu | 0 | 0 | 0 |
| Thai | 0 | 0 | 5 |
| Tibetan languages | 0 | 0 | 0 |
| Tigrigna | 0 | 0 | 0 |
| Turkish | 0 | 0 | 0 |
| Ukrainian | 5 | 5 | 5 |
| Urdu | 0 | 0 | 0 |
| Vietnamese | 10 | 5 | 5 |
| Yiddish | 0 | 0 | 0 |
| Other languagesCensus data footnote 22 | 5 | 5 | 0 |
| Multiple responses | 1,375 | 650 | 725 |
| English and French | 1,215 | 580 | 635 |
| English and non-official language | 125 | 60 | 70 |
| French and non-official language | 20 | 5 | 10 |
| English, French and non-official language | 10 | 10 | 10 |
| Detailed other language spoken regularly at home | |||
| Detailed other language spoken regularly at home - Total population excluding institutional residentsCensus data footnote 19 | 78,450 | 38,695 | 39,755 |
| None | 61,140 | 30,320 | 30,815 |
| Single responses | 17,235 | 8,340 | 8,890 |
| English | 12,475 | 6,085 | 6,390 |
| French | 4,320 | 2,025 | 2,300 |
| Non-official languages | 440 | 230 | 205 |
| Selected Aboriginal languagesCensus data footnote 20 | 55 | 30 | 25 |
| Atikamekw | 0 | 0 | 0 |
| Cree, n.o.s. | 0 | 0 | 0 |
| Dene | 0 | 0 | 0 |
| Innu/Montagnais | 0 | 0 | 0 |
| Inuktitut | 0 | 0 | 0 |
| Mi'kmaq | 55 | 30 | 25 |
| Ojibway | 0 | 0 | 0 |
| Oji-Cree | 0 | 0 | 0 |
| Stoney | 0 | 0 | 0 |
| Selected non-Aboriginal languagesCensus data footnote 21 | 365 | 195 | 175 |
| African languages, n.i.e. | 0 | 0 | 0 |
| Afrikaans | 0 | 0 | 0 |
| Akan (Twi) | 0 | 0 | 0 |
| Albanian | 0 | 0 | 0 |
| Amharic | 0 | 0 | 0 |
| Arabic | 30 | 15 | 15 |
| Armenian | 0 | 0 | 0 |
| Bantu languages, n.i.e. | 0 | 0 | 5 |
| Bengali | 0 | 0 | 0 |
| Berber languages (Kabyle) | 0 | 0 | 0 |
| Bisayan languages | 5 | 5 | 0 |
| Bosnian | 0 | 0 | 0 |
| Bulgarian | 0 | 0 | 0 |
| Burmese | 0 | 0 | 0 |
| Cantonese | 5 | 0 | 0 |
| Chinese, n.o.s. | 0 | 5 | 0 |
| Creoles | 5 | 0 | 5 |
| Croatian | 0 | 0 | 0 |
| Czech | 0 | 5 | 0 |
| Danish | 5 | 0 | 0 |
| Dutch | 20 | 15 | 10 |
| Estonian | 0 | 0 | 0 |
| Finnish | 5 | 0 | 5 |
| Flemish | 0 | 0 | 0 |
| Fukien | 0 | 0 | 0 |
| German | 75 | 40 | 35 |
| Greek | 5 | 5 | 0 |
| Gujarati | 0 | 0 | 0 |
| Hakka | 0 | 0 | 0 |
| Hebrew | 5 | 0 | 0 |
| Hindi | 10 | 5 | 5 |
| Hungarian | 0 | 0 | 0 |
| Ilocano | 0 | 0 | 0 |
| Indo-Iranian languages, n.i.e. | 0 | 0 | 0 |
| Italian | 10 | 5 | 5 |
| Japanese | 20 | 10 | 10 |
| Khmer (Cambodian) | 0 | 0 | 0 |
| Korean | 5 | 0 | 0 |
| Kurdish | 0 | 0 | 0 |
| Lao | 0 | 0 | 0 |
| Latvian | 0 | 0 | 0 |
| Lingala | 5 | 0 | 0 |
| Lithuanian | 0 | 0 | 0 |
| Macedonian | 0 | 0 | 0 |
| Malay | 0 | 0 | 0 |
| Malayalam | 5 | 0 | 0 |
| Maltese | 0 | 0 | 0 |
| Mandarin | 15 | 5 | 10 |
| Marathi | 0 | 0 | 0 |
| Nepali | 0 | 0 | 0 |
| Niger-Congo languages, n.i.e. | 5 | 0 | 5 |
| Norwegian | 0 | 0 | 0 |
| Oromo | 0 | 0 | 0 |
| Panjabi (Punjabi) | 0 | 0 | 0 |
| Pashto | 0 | 0 | 0 |
| Persian (Farsi) | 0 | 0 | 0 |
| Polish | 10 | 0 | 5 |
| Portuguese | 15 | 5 | 10 |
| Romanian | 0 | 5 | 0 |
| Rundi (Kirundi) | 0 | 0 | 0 |
| Russian | 5 | 0 | 5 |
| Rwanda (Kinyarwanda) | 0 | 0 | 0 |
| Semitic languages, n.i.e. | 0 | 0 | 0 |
| Serbian | 0 | 0 | 0 |
| Serbo-Croatian | 0 | 0 | 0 |
| Shanghainese | 0 | 0 | 0 |
| Sign languages, n.i.e. | 5 | 5 | 0 |
| Sindhi | 0 | 0 | 0 |
| Sinhala (Sinhalese) | 0 | 0 | 0 |
| Sino-Tibetan languages, n.i.e. | 0 | 0 | 0 |
| Slavic languages, n.i.e. | 0 | 0 | 0 |
| Slovak | 5 | 0 | 5 |
| Slovenian | 0 | 0 | 0 |
| Somali | 0 | 0 | 0 |
| Spanish | 60 | 40 | 20 |
| Swahili | 10 | 5 | 0 |
| Swedish | 5 | 0 | 0 |
| Tagalog (Pilipino, Filipino) | 20 | 10 | 10 |
| Taiwanese | 0 | 0 | 0 |
| Tamil | 0 | 0 | 0 |
| Telugu | 0 | 0 | 0 |
| Thai | 5 | 5 | 0 |
| Tibetan languages | 0 | 0 | 0 |
| Tigrigna | 0 | 0 | 0 |
| Turkish | 0 | 0 | 0 |
| Ukrainian | 0 | 0 | 0 |
| Urdu | 0 | 0 | 0 |
| Vietnamese | 10 | 5 | 5 |
| Yiddish | 0 | 0 | 0 |
| Other languagesCensus data footnote 22 | 15 | 10 | 10 |
| Multiple responses | 70 | 30 | 40 |
| English and French | 5 | 0 | 5 |
| English and non-official language | 30 | 10 | 15 |
| French and non-official language | 35 | 15 | 25 |
| English, French and non-official language | 0 | 0 | 0 |
Symbols
.. not available for a specific reference period
Data quality index: Data quality index showing a global non response rate higher than or equal to 25% (suppressed). Geographic area suppression lists show areas where data are suppressed.
Incompletely enumerated Indian reserve and Indian settlement: There were 13 Indian reserves and Indian settlements where enumeration was not possible as a result of forest fires in Northern Ontario at the time of census collection. Collection for these communities was done at a later time. While the data are not included in the 2011 Census tabulations, it is expected that separate special tables showing data for these communities will be made available at a later date, subject to data quality evaluation. Refer to a complete list of these geographic areas.
... not applicable
A possible reason for the use of the three dots (...) symbol is:
- A value that cannot be calculated such as a percentage change where the denominator is zero.
Census data: Footnotes
- Footnote 1
-
Statistics Canada is committed to protect the privacy of all Canadians and the confidentiality of the data they provide to us. As part of this commitment, some population counts of geographic areas are adjusted in order to ensure confidentiality.
Counts of the total population are rounded to a base of 5 for any dissemination block having a population of less than 15. Population counts for all standard geographic areas above the dissemination block level are derived by summing the adjusted dissemination block counts. The adjustment of dissemination block counts is controlled to ensure that the population counts for dissemination areas will always be within 5 of the actual values. The adjustment has no impact on the population counts of census divisions and large census subdivisions.
- Footnote 2
-
A separate set of living quarters designed for or converted for human habitation in which a person or group of persons reside or could reside. In addition, a private dwelling must have a source of heat or power and must be an enclosed space that provides shelter from the elements, as evidenced by complete and enclosed walls and roof, and by doors and windows that provide protection from wind, rain and snow.
- Footnote 3
-
A separate set of living quarters which has a private entrance either directly from outside or from a common hall, lobby, vestibule or stairway leading to the outside, and in which a person or a group of persons live permanently.
- Footnote 4
-
Refers to the age at last birthday before the reference date, that is, before May 10, 2011.
Refer to the Census Dictionary for more information.
- Footnote 5
-
The median age is an age 'x', such that exactly one half of the population is older than 'x' and the other half is younger than 'x'.
- Footnote 6
-
Refers to the marital status of the person, taking into account his/her common-law status. For more information, refer to the Census Dictionary: Marital status.
- Footnote 7
-
Census family - Refers to a married couple (with or without children), a common-law couple (with or without children) or a lone parent family. For more information, refer to the Census Dictionary: Census family.
- Footnote 8
-
Census family structure - Refers to the classification of census families into married couples (with or without children of either and/or both spouses), common-law couples (with or without children of either and/or both partners), and lone-parent families by sex of parent. A couple may be of opposite or same sex. A couple with children may be further classified as either an intact family or stepfamily, and stepfamilies may, in turn, be classified as simple or complex. Children in a census family include grandchildren living with their grandparent(s) but with no parents present.
- Footnote 9
-
Non-relatives may be present.
- Footnote 10
-
Refers to the basic division of private households into family and non-family households. Family household refers to a household that contains at least one census family, that is, a married couple with or without children, or a couple living common-law with or without children, or a lone parent living with one or more children (lone-parent family). One-family household refers to a single census family (with or without other persons) that occupies a private dwelling. Multiple-family household refers to a household in which two or more census families (with or without additional persons) occupy the same private dwelling. Family households may also be divided based on the presence of persons not in a census family.
Non-family household refers to either one person living alone in a private dwelling or to a group of two or more people who share a private dwelling, but who do not constitute a census family.
- Footnote 11
-
Refers to households that consist solely of one census family without additional persons.
- Footnote 12
-
Refers to households with opposite-sex or same-sex couples.
- Footnote 13
-
Refers to one-census family households with additional persons and to multiple-census family households, with or without additional persons.
- Footnote 14
-
Refers to households with opposite-sex or same-sex couples.
- Footnote 15
-
Structural type of dwelling - Characteristics that define a dwelling's structure, for example, the characteristics of a single-detached house, a semi-detached house, a row house, or an apartment or flat in a duplex. Refers to the structural characteristics and/or dwelling configuration, that is, whether the dwelling is a single-detached house, an apartment in a high-rise building, a row house, a mobile home, etc.
- Footnote 16
-
Includes mobile homes and other movable dwellings such as houseboats and railroad cars.
- Footnote 17
-
The category 'Other dwelling' is a subtotal of the following categories: semi-detached house, row house, apartment or flat in a duplex, apartment in a building that has fewer than five storeys and other single-attached house.
- Footnote 18
-
Household, private - Person or group of persons occupying the same dwelling. Refers to a person or a group of persons (other than foreign residents) who occupy a private dwelling and do not have a usual place of residence elsewhere in Canada.
Household size - Number of persons occupying a private dwelling. Refers to the number of usual residents in a private household.
- Footnote 19
-
The population excluding institutional residents includes Canadian citizens (by birth or by naturalization) and landed immigrants (permanent residents) excluding those who live in institutions (institutional collective dwellings). Canadian citizens and landed immigrants either: (1) have a usual place of residence in Canada; (2) are abroad either on a military base or attached to a diplomatic mission; or (3) are at sea or in port aboard merchant vessels under Canadian registry or Canadian government vessels. Since 1991, the target population also includes persons with a usual place of residence in Canada who are claiming refugee status, who hold study permits, or who hold work permits, as well as family members living with them; for census purposes, this group is referred to as non-permanent residents. The population universe does not include foreign residents.
- Footnote 20
-
The languages shown were selected based on the Aboriginal mother tongues most often reported as single responses in Canada in the 2011 Census of Population.
- Footnote 21
-
The languages shown were selected based on the non-Aboriginal mother tongues (other than English or French) most often reported as single responses in Canada in the 2011 Census of Population.
- Footnote 22
-
This is a subtotal of all languages collected by the census that are not displayed separately here. For a full list of languages collected in the census, please refer to Appendix D in the 2011 Census Dictionary.
- Footnote 23
-
English is the first official language spoken by Quebec's official language minority, which consists of all individuals with English as a first official language spoken and half of those with both English and French. French is the first official language spoken by the official language minority in the country overall and in every province and territory outside Quebec, which consists of all individuals with French as a first official language spoken and half of those with both English and French.
How to cite
How to cite: Statistics Canada. 2013. Beauséjour, New Brunswick (Code 13002) (table). National Household Survey (NHS) Profile. 2011 Census. Statistics Canada Catalogue no. 99-004-XWE. Ottawa. Released June 26, 2013.
http://www12.statcan.gc.ca/nhs-enm/2011/dp-pd/prof/index.cfm?Lang=E (accessed May 16, 2024).
Data source
2011 Census of Population
Download census data for complete geographic level
Related links
Map
Map
Map: Beauséjour (Federal electoral district, 2013 Representation Order), New Brunswick
Alternative format(s): pdf | ARCHIVED – Reference map (interactive tool)
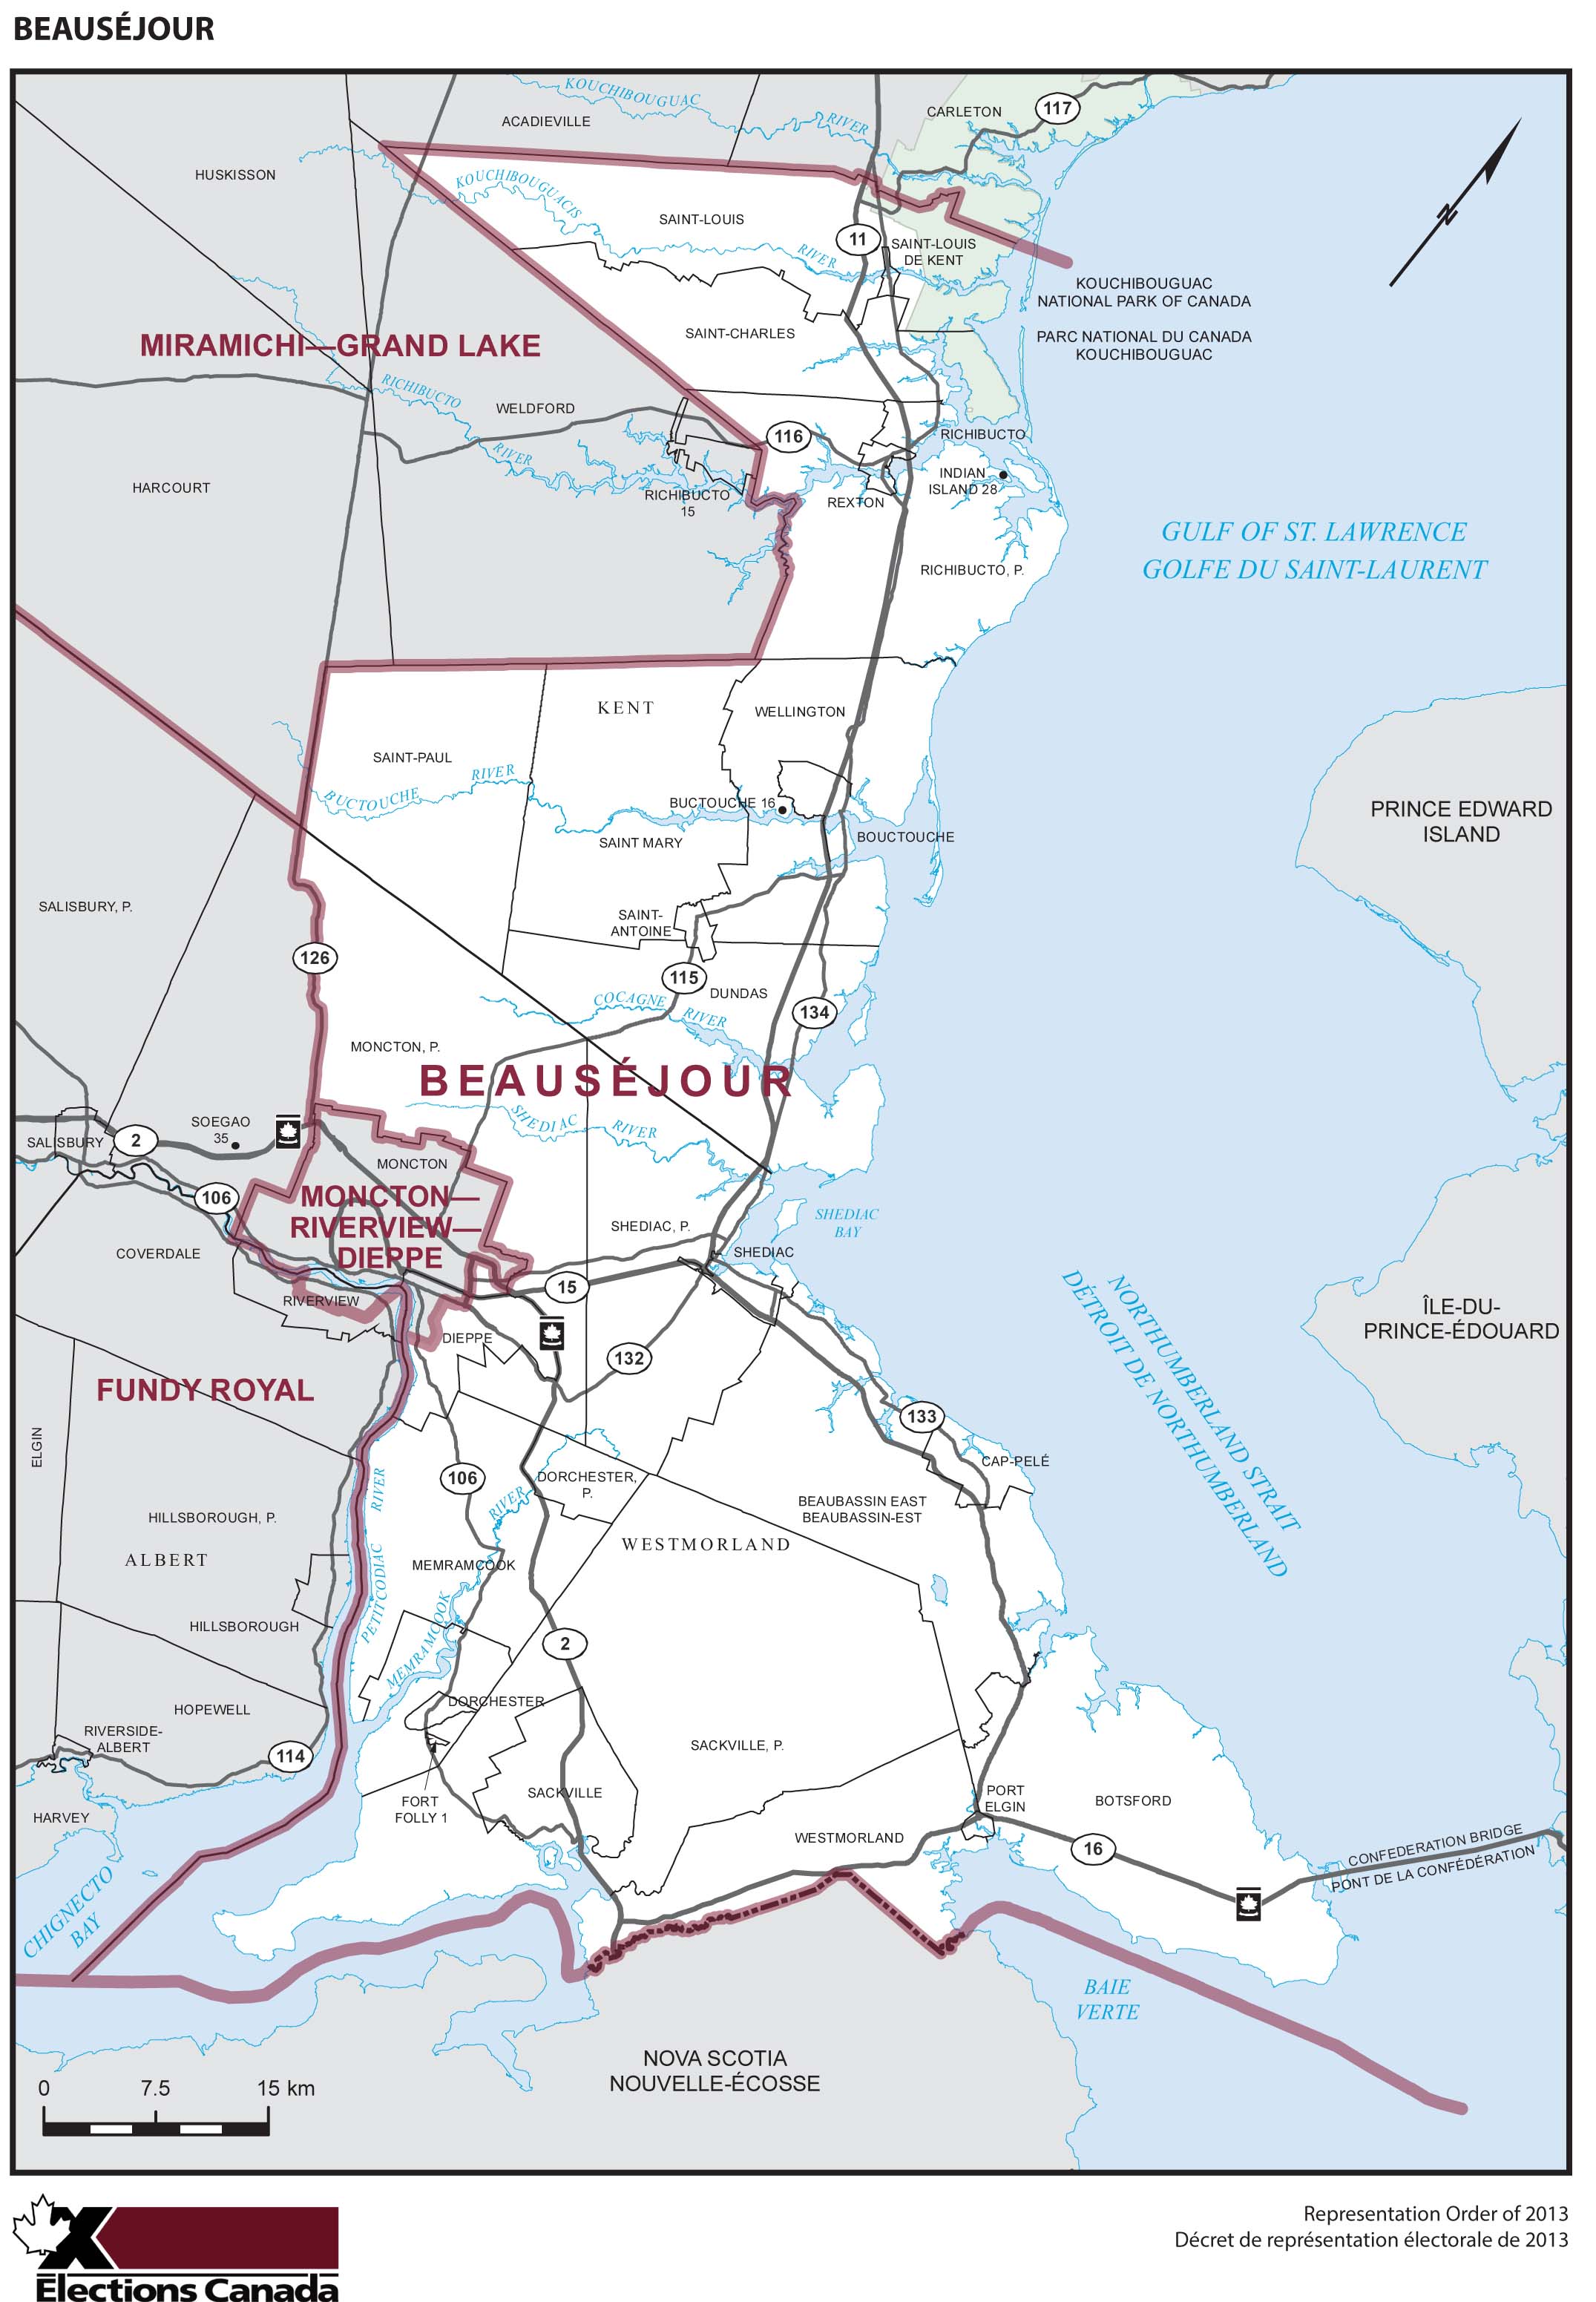
Geographic hierarchy
Geographic hierarchy
Geographic hierarchy: Beauséjour, New Brunswick (Federal electoral district, 2013 Representation Order)
-
Canada
-
New Brunswick (Province)
- Beauséjour
-
New Brunswick (Province)
Note
Note: For more information regarding geographic hierarchies, refer to the Illustrated Glossary: Hierarchy of standard geographic units tutorial.
Related data
Related data
Related data: Beauséjour (Federal electoral district, 2013 Representation Order), New Brunswick
2011 NHS
- Additional NHS data are not available for this area. Please refer to the 2011 NHS Data Products for additional geographies.
2011 Census
- Topic-based tabulations, Beauséjour (Federal electoral district, 2013 Representation Order), New Brunswick
- Census Profile, Beauséjour (Federal electoral district, 2013 Representation Order), New Brunswick, 2011
- Date modified: